
Hero Honda's Dividend Policy
🌐 International Buyers — Pay via PayPal
Details
FINA005
11
2004
NO
300
Hero Honda Motors Ltd.
Automotive
India
Corporate Finance,Cost of Capital
Abstract
Hero Honda is India's largest two-wheeler manufacturer. The company has a history of rewarding shareholders handsomely. The case discusses Hero Honda's dividend policy and how it is linked with other aspects of the company's financial strategy
Learning Objectives
The case is structured to achieve the following Learning Objectives:
- 0
Contents
We did look at buyback but we are not convinced that it would enhance shareholders value. Only the promoters will benefit. It is better to earn the shareholders goodwill by giving them higher dividends.
- Brijmohan Lall Munjal, Chairman, Hero Honda.
In 2004, India's largest two-wheeler manufacturer, Hero Honda Motors Limited (Hero Honda) had announced a huge 1000% dividend following a 25% increase in its net profits and 14.3% increase in net sales.2 The company had declared a final dividend of Rs.10 per share and a special dividend of Rs.8 per share, representing almost 70% payout of profits in 2003.
Hero Honda had a 47.6% overall share of the motorcycle market and a 33 % overall share of the two-wheeler market during 2003-043. The company had emerged as one of the most successful players in the industry, on account of its superior and reliable product quality and aggressive marketing. Hero Honda’s motorcycles enjoyed a strong brand equity due to their fuel-efficiency and sleek looks backed by a well spread distribution and after sales network.
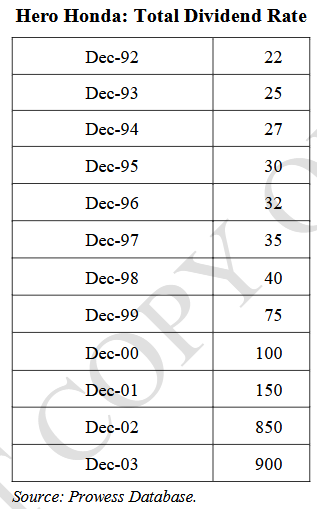
Hero Honda had a history of rewarding shareholders handsomely. In 2002-03, Hero Honda announced a 900% dividend amounting to $80 million or more than two-thirds of its net profits as dividends. In 2001-02, the company had paid 850% dividend amounting to about $75 million, or about 76% of its net profits. The company’s high dividend payouts had attracted significant media attention. Many analysts wondered whether it was prudent to make such high payouts at a time when competition was intensifying.
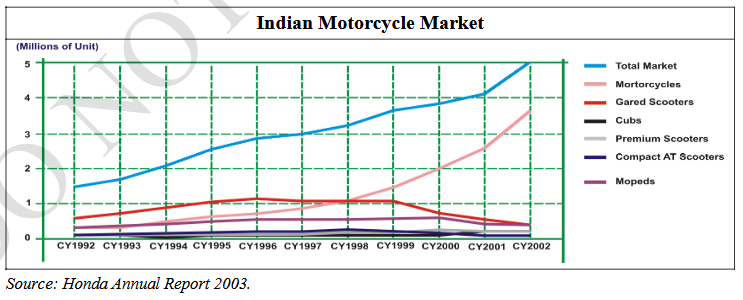
Two-wheelers had become the standard mode of transportation in many of India’s large urban centers. Use of two-wheelers in the rural areas had also increased significantly in the 1990s.
Figure (i)
 |
The birth of the Indian two-wheeler industry could be traced to the early 1950s, when Automobile Products of India (API) started manufacturing scooters in the country. While API initially dominated the scooter market with its Lambrettas, it was Bajaj Auto Limited, which rapidly emerged as the unchallenged leader in the scooter industry. A number of government and private enterprises who had entered the scooter segment, disappeared from the market by the turn of the century.
The License Raj that existed prior to economic liberalization (1940s-1980s) in India did not allow foreign players to enter the market, making it an ideal breeding ground for local players. But the Raj also hurt the growth of the industry by imposing various restrictions. In the mid-80s, the government started permitting foreign companies to enter the Indian market, through minority joint ventures. During this period, the two-wheeler market witnessed a boom with Japanese players like Honda, Suzuki, Yamaha and Kawasaki, entering the market through joint ventures.
Foreign players quickly changed the rules of the game. From a supplier’s market, it became a buyer’s market. Companies tried to outdo each other in terms of style, price and fuel efficiency. The technological expertise that the foreign collaborators brought to the marketplace helped increase the overall quality of the products quite significantly. In the early 2000s, the competition intensified further. In 2000, Honda announced its intentions to set up a 100% subsidiary to manufacture scooters and motorcycles.
The Indian two-wheeler industry had seen remarkable growth rates from 2000, due to various factors like fall in interest rates, availability of finance and affordable prices relative to the growing purchasing power. Despite the impressive growth rate of the last few years, two-wheeler penetration still remained low in the country. Analysts believed, increasing urbanization, expanding cities, lack of other modes of mobility and favourable demographics would support double digit growth in the coming decade.
The Indian two-wheeler industry could be broadly classified into three major segments— scooters, motorcycles and mopeds. Until the early 1990s, locally manufactured scooters with gears dominated the markets. But in recent times, demand for scooters had tapered off, while that for motorcycles looked buoyant. The motorcycle market in India had tripled in size over the past 10 years5. In 2002, the two-wheeler industry demand totaled 5 million units, making India the second largest market in the world after China.
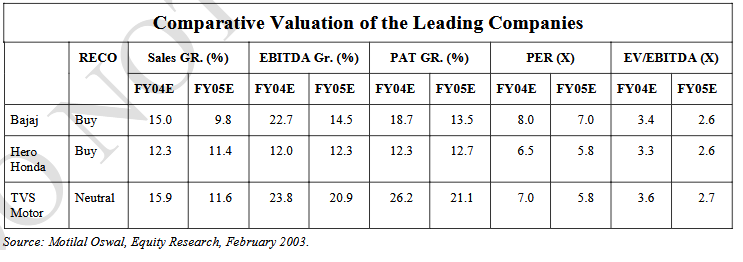
Exhibit: I
 |
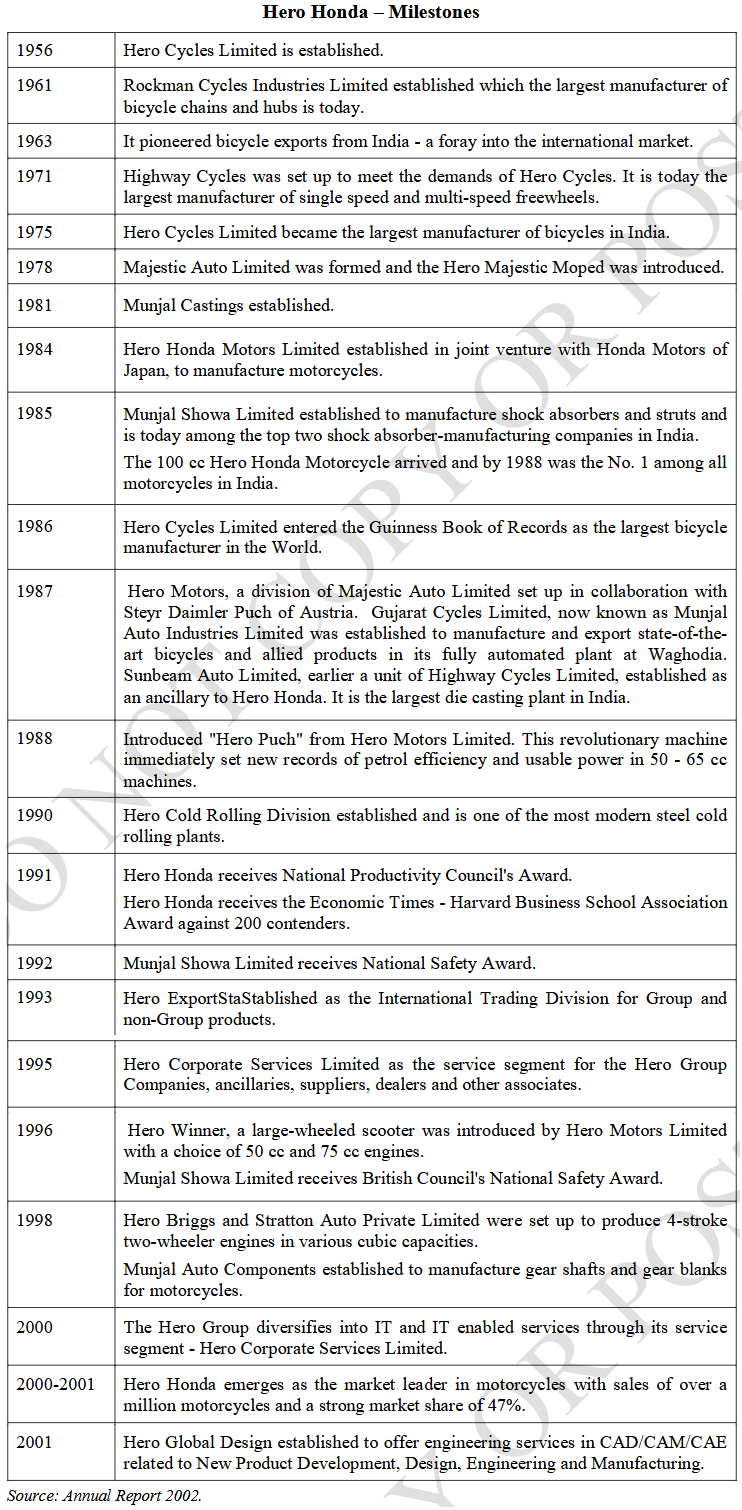
“Hero”, the brand name, which symbolized the ambition of the Munjal brothers, came into being in 1956. Brijmohan Lall Munjal (Lall), the first generation business entrepreneur of the 1950s, inspired the Hero Group with his vision of sound business governance and value driven management practices.
Figure (ii)
 |
In 1984, Honda Motor Corporation (HMC) approached the Hero Group for its motorcycle venture. The market for motorcycles was not booming in any sense of the term in the early 1980s. Scooters were the order of the day. Many Indian companies still believed that motorcycles were more accident prone and less safe for Indian roads. But the Munjals saw a great opportunity. They felt that entering into a joint venture with a company like Honda would be the first step towards dominating the two-wheeler market in India.
HMC agreed to provide technical know-how to Hero Group and assist in setting up the manufacturing facilities. This included providing the design specifications and responsibility for future R&D efforts relating to the product lines that the company would offer. Each partner held a 26% equity stake. Another 26% was sold to the public, with the rest being held by the financial institutions.
In 1995, the joint venture, after renegotiating the terms, was extended until 2004. The Munjals got far more attractive terms from HMC with respect to royalties. In 1984, the company agreed to pay HMC a lump sum fee of $500,000 and a 4% royalty on the net ex-factory sale price of the product. Licenses to manufacture future models were dealt with on a case-by-case basis using a mix of lump sum payments or royalties. By 1999, the proportion of royalty payments to sales revenues had declined considerably from 4% to 0.5%.
Hero Honda built an extensive network of primary and secondary suppliers for components and subassemblies. By 1996, over 95% of the motorcycles were manufactured from locally procured parts. The Munjal family had promoted various firms to supply components, ranging from shock absorbers and wheel rims, to aluminum castings and plastic products. There were over 300 ancillary units by 2003, whose production was dedicated to Hero's requirements. The Munjals made it a point to extend technical and managerial support to these ancillaries.
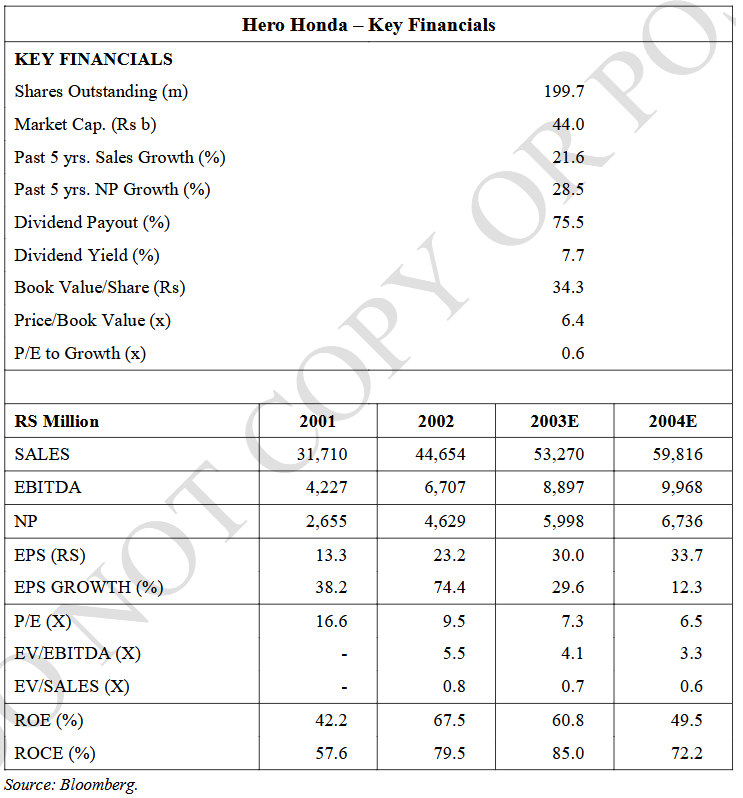
Hero Honda grew impressively, producing 1.3 million vehicles in 2001. Production of motorcycles nearly quadrupled during the period 1997-2001. While the motorcycle market grew at an average of 21.74% per annum during the period, Hero Honda averaged a growth rate of 35.46% per annum. In 2004, Hero Honda produced 2.1 million vehicles to record sales of Rs. 5,832 crore and net profit of Rs. 728 crore.
Exhibit: II
 |
With increasing competition from players like Bajaj and TVS-Suzuki, Hero Honda became more aggressive in launching new products. It was among the first manufacturers to understand the impact of product differentiation and market segmentation on the sales revenues. The mantra of fuel economy formed the core of all Hero Honda product launches.
Cost Management
Hero Honda continued to cut costs by streamlining its manufacturing activities. Ratio of operating profit before depreciation interest and tax (OPBDIT) to net sales had increased from 15.0% in 2001-02, to 16.6% in 2002-03 (despite the celebration offer', in which a cash discount of Rs.1,001 was given to each new customer). The increase in operating profit margin was primarily due to two reasons— reduction in the material cost to net sales ratio, (which had come down from 69.4% in 2001-02, to 68% in 2002-03) and reduction in manufacturing variable costs.
The reduction in the material cost to net sales ratio had been achieved through indigenisation and through value engineering by ancillaries and vendors. This had been accompanied by a decline in variable manufacturing cost (power and fuel, consumables, tools, warranty, rejection, repairs and maintenance). The average variable cost per vehicle had come down consistently in the last few years. Between 1997-98 and 2002-03, the variable cost of manufacturing declined by almost 48%.
Working Capital Management
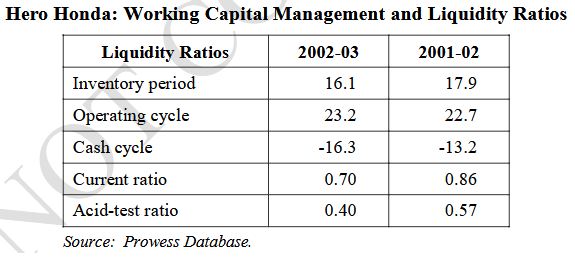
With an operating cycle of less than 30 days and a cash cycle of (-) 16.3 days, Hero Honda was considered one of the most efficient companies in the industry in working capital management. The company continued its efforts to improve its working capital management. Inventory holding period for the company decreased from 17.9 days in 2001-02 to 16.1 days in 2002-03. The operating cycle of the company increased marginally from 22.7 days in 2001-02 to 23.2 days in 2002-03, primarily due to an increase in the receivables period. But an increase in the payables period resulted in the cash cycle of the company decreasing from (-) 13.2 days in 2001-02 to (-) 16.3 days in 2002-03. Hero Honda saved Rs. 75 crore on material costs in 2003-04, down from Rs 120 crore saved in 2002-03. The company also earned a substantial amount in other income of Rs. 165 crore in 2003-04, mostly from treasury operations.
Exhibit III
 |
Capital Structur
Hero Honda had traditionally followed a conservative financial strategy. It was a zero long-term debt company. The unsecured loan of Rs.134 crores from the state government of Haryana on account of sales tax deferment, was interest free. Net interest payment by the company was negative during 2002 and 2003.
Dividend Policy
Hero Honda’s financial strategy emphasized the efficient use of capital to generate returns which exceeded the cost. Hero Honda also believed that the funds in excess of what was needed for capital and other strategic investments had to be returned to the shareholders. The company’s normal dividend policy was to distribute about 40% of profit after tax (PAT). The 1000% dividend declared in 2004, comprised an outgo of Rs 454 crore (including tax of 12.5%).9 Hero Honda paid a total dividend of 900% in 2003 and 850% in 2001-02. The board recommended a total dividend of 1000% in 2003-04, including a special dividend of 500%. After paying out the dividend, the company had a cash reserve, of 1,500 crore as on 31st March 2004. According to company sources, if an investor had bought 100 shares of Hero Honda on 31st March 1993, over the last ten years, he would have earned an average annual 19% internal rate of return (IRR) on his investment through
dividend income alone. According to rough estimates, with this money, the company could have bought 51% of rival TVS. Alternatively, it could have built three new plants.
Exhibit: IV
 |
Hero Honda’s dividend policy contrasted sharply with that of its competitor, Bajaj Auto. Bajaj was sitting on a cash reserve of $ 575 million and paid a final dividend of 120% and a special dividend of 20% in 2002 and a final dividend of 140% in 2003.
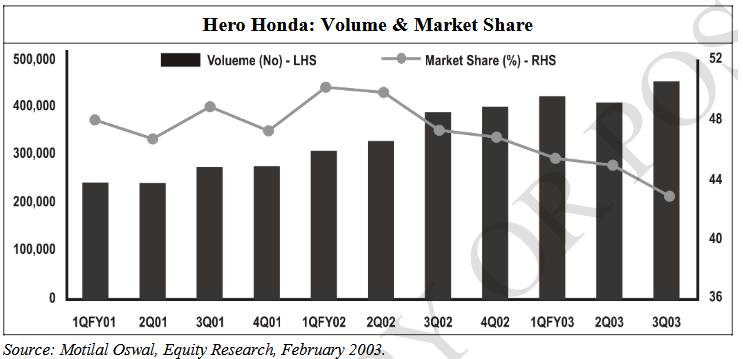
Some analysts were surprised at the huge dividend payout, in view of increasing competition. Japanese companies such as Honda and Toyota were planning to set up their units in India on their own. Yamaha had bought out the stake of the Nandas (Escorts) from their joint venture and ran a wholly owned subsidiary in India. Suzuki had cut its ties with the TVS Group and ventured out on its own. Honda was expected to start selling its motorcycles in India on its own from 2004. Critics of Hero Honda’s dividend policy pointed to the drop in Hero Honda’s market share by about 4% in 2002, the first ever drop in many years. During the last quarter of 2002, the company’s sales and profits dropped marginally due to the slow response to rival product launches. Meanwhile, Hero Honda’s R&D investments lagged behind competitors. In 2002, the company spent only $ 1.5 million on R&D while TVS, which was less than half of Hero Honda, spent $ 6.4 million.
Even as the debate about the wisdom of paying big dividends continued, the overwhelming image that shareholders had of Lall, was that of a benevolent patriarch, who treated his shareholders as one large family. Lall’s eagerness to make his shareholders happy was undisputed.
Lall believed that since Hero Honda did not have any major investment plan, the company did not need so much free cash. Hero Honda also had plans to move into the lower end of the motorcycle market to improve its market share. Lall was confident that the company could pass on higher discounts on its products, settle for lower profit margins and retain market share.
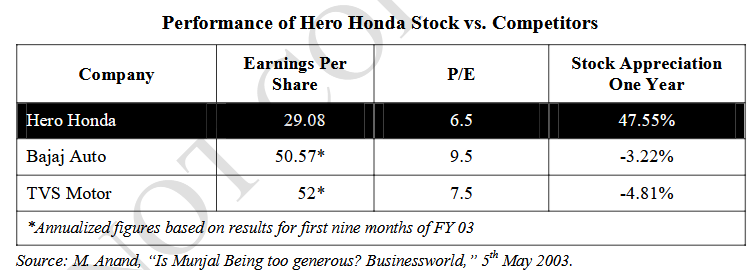
Meanwhile, there were some analysts who argued that Hero Honda might have benefited more from a share buyback. A buyback could have reduced Hero Honda’s equity base, increased its earnings per share (EPS) and driven up the stock price. In 2003, Hero Honda’s stock price was near its 52-week low, which made the buyback very attractive. These analysts cited the example of Bajaj which had bought 15% of its equity back in 2000, by spending $ 153 million.
The two-wheeler industry was expected to show double-digit growth in 2003-04. Rising income levels, the poor quality of public transport, declining interest rates, easier availability of loans, shortening product life cycles and the growing percentage of young population were factors that could contribute to the growth. In the last few years, a fundamental shift in preference had taken place from scooters and mopeds towards motorcycles. Motorcycle sales had grown at a CAGR of 27% for the last six years vs. two-wheelers, which had grown at a CAGR of 11% over the same period. The faster growth rate of motorcycles had seen Hero Honda’s share of the two-wheeler market doubling from 38% in 1997-98 to 76% in 2002-03.
Exhibit V
 |
In 2004, Hero Honda, ended with a turnover of Rs 5,997 crore, up 15% over Rs 5,195 crore in 2003. Hero Honda had not only missed its sales target for 2003, but also witnessed a fall in market share to 44%, compared to 49% in 2002. Volumes suffered due to the poor monsoons and rising competitive pressure. However, in value terms, Hero Honda had met its target turnover of Rs 5000 crores. The savings in raw material and interest costs also led to improvement in margins and profitability. In 2004-05, Hero Honda also planned to set up its third manufacturing plant. It could also enter the scooter segment in the future, as the earlier agreement with Honda of not entering the scooter segment was getting expired in 2004.
Hero Honda's phenomenal growth had been the result of process innovations, a close control on costs and Lall’s dynamic leadership. But at the same time, some analysts were worried that having set a precedent of high dividends, the company might disappoint shareholders if it reduced the dividend payout in the future.
Exhibit VI
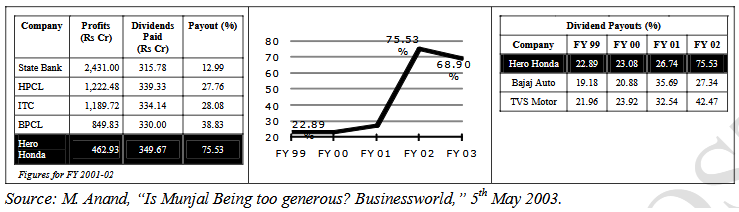 |
Exhibit: VII
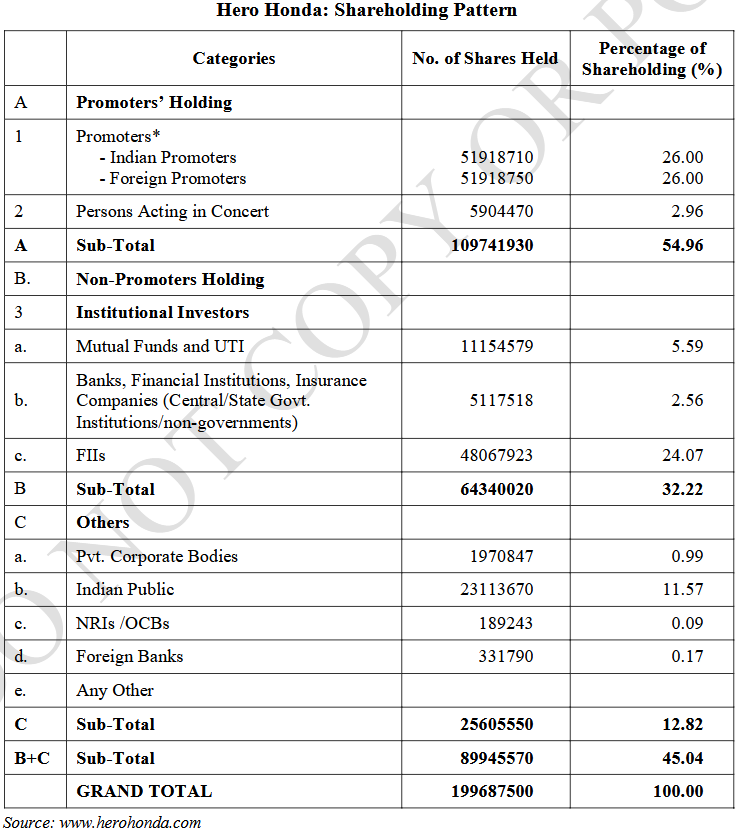 |
Exhibit: VIII
 |
Keywords
Indian two-wheeler industry, Hero Honda Motors Limited, Honda Motor Corporation, Financial management, Cost management, Working capital management, Capital structure, Dividends, Dividend policy, Dividend pay out
Related Case Studies
| Case Title | Details | Price | Add to Cart |
|---|---|---|---|
|
Case Title Nykaa IPO: Will It Translate the Beauty and Personal Care Market Opportunity into Big Profits?Case Code: FINC200 |
Details | 400 | Add to Cart |
|
Case Title Apple`s Green BondsCase Code: FINC199 |
Details | 300 | Add to Cart |
|
Case Title The Evergrande Crisis in ChinaCase Code: FINC197 |
Details | 500 | Add to Cart |
|
Case Title Stock Split: A Case of IRCTCCase Code: FINC189 |
Details | 400 | Add to Cart |
|
Case Title Krishna Institute of Medical Sciences IPO: Should You Invest or Not?Case Code: FINC187 |
Details | 500 | Add to Cart |