
Financial Risk Management at Toyota
🌐 International Buyers — Pay via PayPal
Details
FINA012
16
2003
NO
500
Toyota Motor Corporation
Automotive
Japan
Financial strategy ,Financial Options & Derivatives
Abstract
Toyota Motor Corporation (Toyota) is Japan’s largest and the world’s fourth-largest automobile manufacturer. The company offers well-known car models like Camry, Corona, Corolla and Lexus. Though a late entrant, compared to General Motors and Ford, Toyota has become one of the strongest players in the automobile industry. Toyota has continued to set new benchmarks for providing value to customers more effectively than competitors. Toyota is exposed to market risk due to changes in currency rates, interest rates and certain commodity and equity prices. In order to manage these risks, Toyota uses various derivative financial instruments. These instruments are in general executed only with creditworthy financial institutions. The case outlines the various financial risks Toyota faces and how the company manages them.
Learning Objectives
The case is structured to achieve the following Learning Objectives:
- 0
Contents
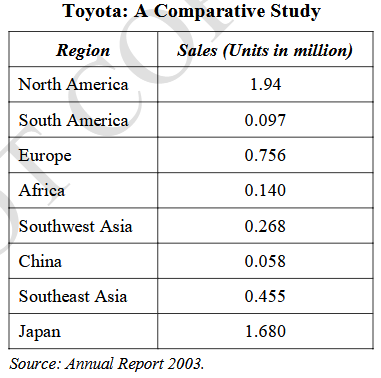
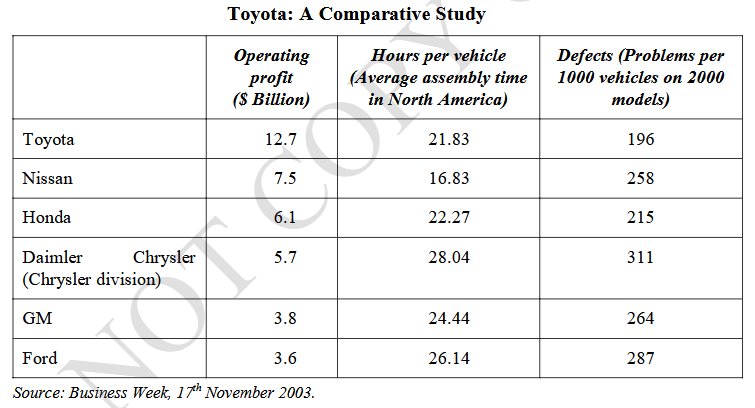
Toyota Motor Corporation (Toyota), Japan’s largest and the world’s fourth-largest automobile manufacturer offered well-known car models like Camry, Corona, Corolla, and Lexus. Though a late entrant, compared to General Motors and Ford, Toyota had become one of the strongest players in the automobile industry. In an industry, generally considered to be mature in terms of technology, Toyota had continued to set new benchmarks for providing value to customers more effectively than competitors. Toyota had also redefined the rules of the game in various areas – product development, manufacturing, vendor management and human resources management. A recent Business Week issue had Toyota on the cover with the caption “Can anything stop Toyota?”
Sakichi Toyoda, born in 1868, founded Toyota. He showed little interest in the family’s carpentry business. Instead, Toyoda concentrated on improving the handloom machinery used in textile factories. These efforts led to the Toyoda Automatic Loom. In 1926, Sakichi founded Toyoda Automatic Loom Works (TALW) to make looms. He entrusted his son Kiichiro with the task of using the profits from the textile machinery business to develop a motor car. In 1933, Kiichiro opened an auto department within the loom works and began copying US engine designs.
After Sakichi died in 1930, Kiichiro faced stiff competition from Ford and General Motors, who had set up their manufacturing units in Japan. Family members including brother Risaburo showed little interest in Kiichiro’s plans. In spite of these difficulties, the articles of association of the company were amended in 1933 to permit automobile manufacturing. It was under Eiji Toyoda, a cousin of Kiichiro that the efforts to develop a car accelerated. In September 1934, the first engine was produced. The company’s first few vehicles had a very high import content. Toyota had to compete by undercutting the prices of established players, Ford and General Motors.
Meanwhile, the Japanese government, realizing the strategic significance of the automobile industry decided to extend support to TALW. Restrictions were placed on the expansion of the operations of Ford and General Motors in Japan. The government also made it compulsory for all new manufacturing facilities with a capacity of more than 3000 vehicles to leave the majority shareholding in the hands of Japanese nationals. Tax reliefs and exemption from duties in the case of imported parts also came in handy for TALW.
In 1936, Toyoda was renamed as Toyota. The formal establishment of Toyota Motor Company Ltd took place in 1937 with a capital base of Yen 12 million. Thus was born a company which would go on to become one of the leaders in the global automobile industry.
Exhibit: I
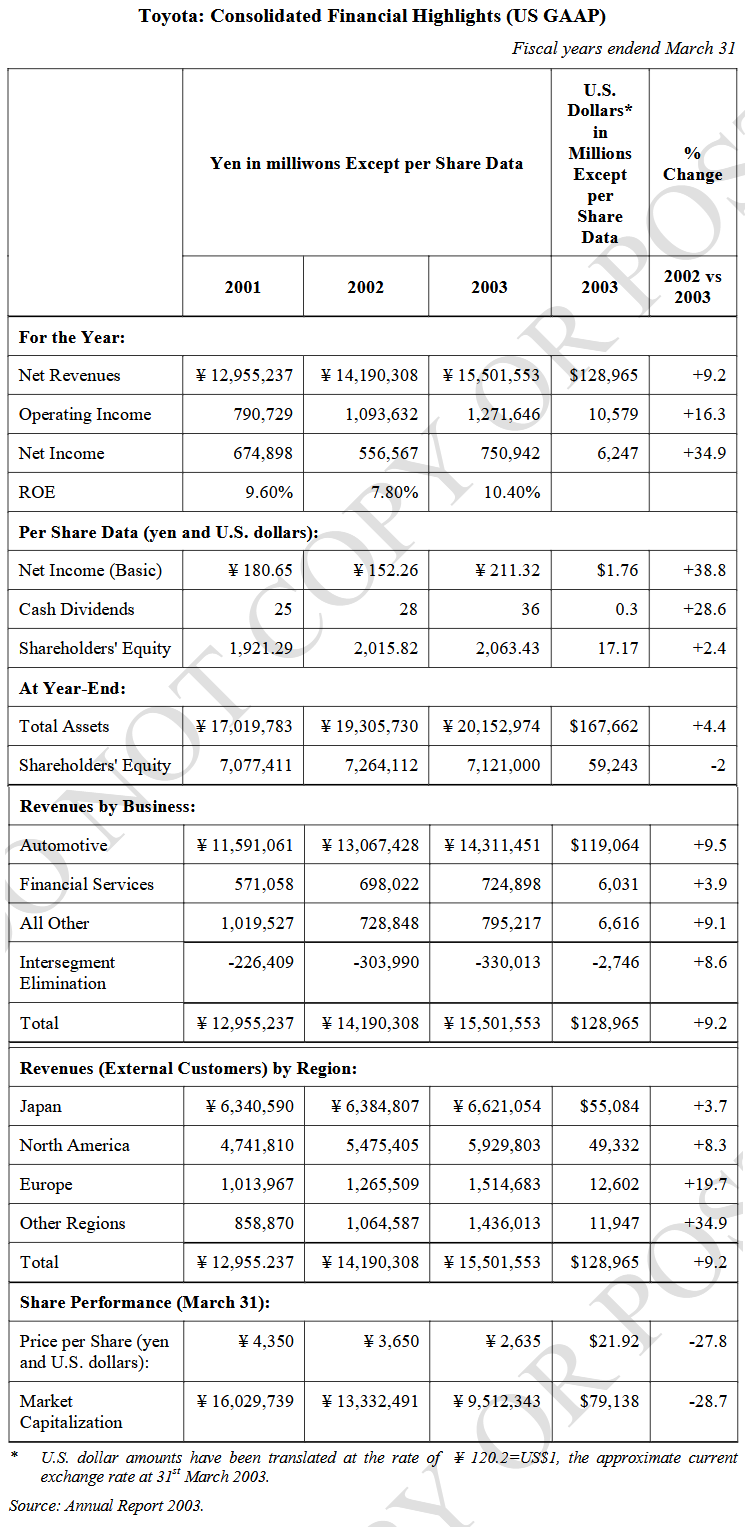 |
Exhibit : II
 |
During World War II, Toyota flourished by selling trucks and buses to the army. Immediately after the war, the economy suffered. Toyota went through a series of financial problems. The company had to be bailed out by a consortium of banks, following the intervention of the Bank of Japan. But various restrictive covenants were imposed. The company was downsized and restructured into separate manufacturing and sales divisions. Kiichiro held himself responsible for the crisis and resigned in 1950.
The Korean War proved to be a major boon for Toyota. The US forces had little time to order vehicles from America. As a result, Toyota was able to obtain major orders. By 1952, Toyota’s financial health had been largely restored. In 1953, car-making activities were revived and Toyota produced 3572 cars. However, the trucks division, which sold 12,422 vehicles still made bulk of the profits.
A turning point in Toyota’s history came when Taiichi Ohno who had earlier been in the Toyoda family’s textile business was entrusted with the responsibility of streamlining the operations and reducing costs. Ohno quickly realised the whole system was rife with muda, (waste). None of the specialists beyond the assembly worker was actually adding any value to the car. Ohno was convinced that assembly workers, because of their direct acquaintance with conditions on the assembly line, could perform actives more efficiently than these specialists.
Ohno began various experiments to correct the state of affairs. He grouped workers into teams which were given a set of assembly steps and find the best way to perform the necessary operations. The team leader coordinated the team activities and even filled in for any absent worker. Such ideas were unheard of in American style mass-production plants. Ohno next gave the team the job of housekeeping, minor tool repair, and quality-checking. Once the teams were operating smoothly, Ohno set time aside periodically for them to suggest ways to improve the process.
Exhibit III
 |
Ohno instituted a systematic way of problem-solving. Production workers were taught to trace systematically every error back to its ultimate cause, then to devise a fix, so that it would never occur again. A major problem that Toyota had faced since its inception was the lack of adequate demand for individual models. The frequent change of dies on the shop floor, increased the cost of production. Ohno developed systems by which dies could be changed in as less as fifteen minutes. Later, the change over time span was further reduced to three minutes.
Meanwhile, Toyota realized the need to improve quality. Defects were often identified after the customer had taken delivery of the car. Under the influence of W. Edwards Deming, Toyota began to show interest in total quality management. The performance of the Corona model helped Toyota to win the prestigious Deming prize for quality in 1965.
Toyota also streamlined its marketing efforts. The company decided to position the Corona to suit the needs of individual customers rather than the taxi operators. With the launch of the Corolla, a compact, luxury car, the automobile market in Japan began to really open up. In 1967, the first full year of production of the Corolla, passenger car sales in Japan increased to almost 1.3 million. Corolla was also launched in the US and helped Toyota to register sales of more than 71,000 cars that year. In 1974, the Toyota Corolla became the largest selling car in the world with sales of 677,455 units.
As part of its increased commitment to the US market, Toyota entered into a joint venture with General Motors (GM) and established New United Motor Manufacturing Inc. (NUMMI). Manufacturing started in one of GM’s non-functional plants in California. Management of the plant was left to Toyota. About 80% of the workforce consisted of employees who had been on the payrolls of GM before the plant’s closure. A replica of the production system at Toyota’s Takaoko plant in Japan was established in California. By 1986, NUMMI was running at full capacity and was able to match the productivity and quality standards of the Takaoko plant. NUMMI manufactured products like Toyota Corolla Sedan, Toyota Tacoma Truck, and Chevrolet Prizm.
Figure: (i)
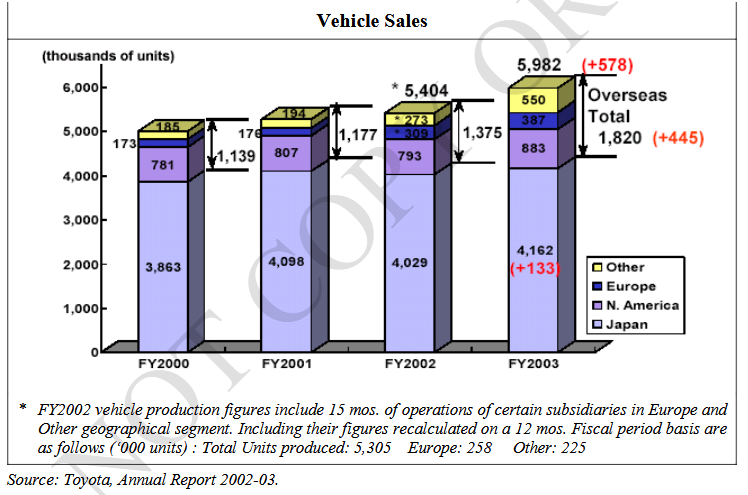 |
Toyota recorded a major achievement in the US market when it successfully launched the Lexus, a luxury car, after elaborate market research. It also introduced 300 HP Supra sports cars and a redesigned coupe, named Celica. Owing to the steep appreciation of the yen and the restrictions put on imports of Japanese cars by Western countries, Toyota stepped up its efforts to set up plants abroad. In 1992, the company started manufacturing cars in Britain.
When Tatsuro Toyoda resigned in 1995 for health reasons, Hiroshi Okuda became the first person from outside the Toyoda family to become Toyota’s president. Okuda announced that Toyota would work towards regaining its original 40% share of the Japanese automobile market. Okuda also announced plans to meet as much as 65% of the company’s sales in Europe and the US from Toyota’s local production plants.
Figure: (ii)
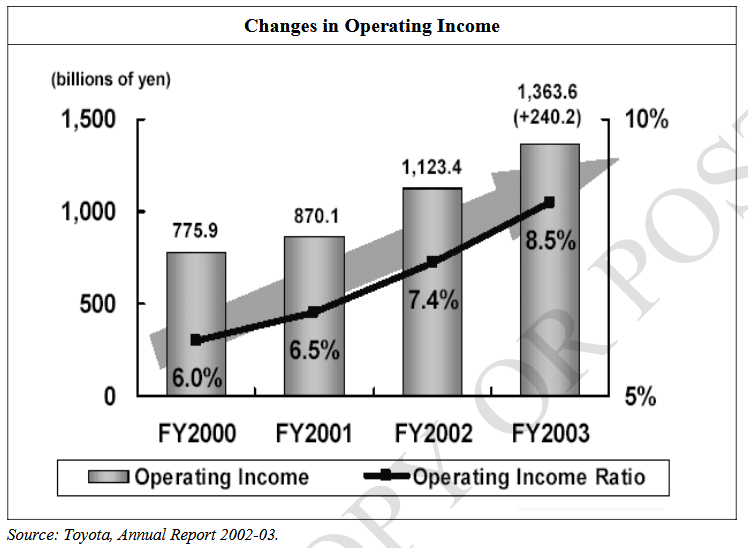 |
In 1996, Toyota consolidated its North American production units into the Cincinnati based Toyota Motor Manufacturing (North America). In 1997, Toyota introduced a hybrid electric and gas powered car called Prius. In 1998, the company increased its stake in Daihatsu to 51%. Daihatsu had an impressive product line of small cars, which complemented Toyota’s sedans. In 1999, Okuda replaced chairman Shoichiro Toyoda and Fujio Cho became the President. In 2000, Toyota launched the WiLL Vi, a sedan aimed at young people. Toyota also made plans to buy a 5% stake in Yamaha (the world's #2 motorcycle maker) and raised its stake in truck maker Hino Motors from about 20% to almost 34%. Toyota concluded an agreement with the Chinese government to produce passenger cars for sale in China. The cars would be built by Tianjin Toyota Motor Corp., a joint venture between Chinese carmaker Tianjin Automobile Xiali and Toyota. Early in 2001, Toyota opened a new plant in France. Later that year, the company formed an agreement with PSA Peugeot Citroen to begin joint car production in Europe by 2005. Toyota also increased its stake in Hino Motors to 50%.
With partners Toyoda Gosei, Ltd. and Horie Metal Co., Ltd., Toyota formed a joint venture in 2002 to manufacture resin fuel tank systems.
In the early 2000s, Toyota continued to make impressive strides. Many analysts, considered Toyota to be the strongest of the global auto manufacturers. As one analyst1 put it, “Toyota combines the size, financial clout and manufacturing excellence needed to dominate the global car industry in a way no company ever has… No car company is as strong as Toyota in so many areas”
Exhibit IV
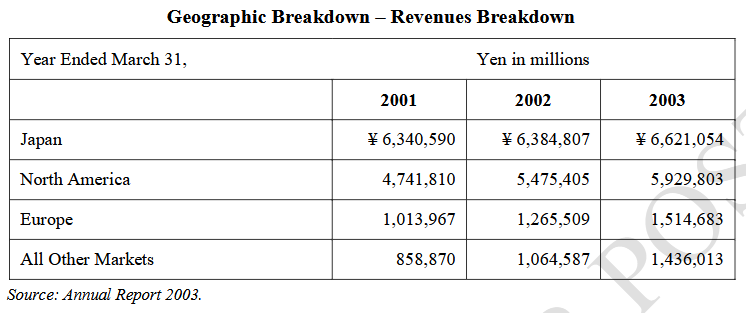 |
Toyota used various financial instruments, in the normal course of business. These instruments were in general executed only with creditworthy financial institutions. Virtually all foreign currency contracts were denominated in U.S. dollars, euros and other currencies of major industrialized countries.
In the unlikely event of the counterparties failing to meet the contractual terms of a foreign currency or an interest rate instrument, Toyota’s risk was limited to the fair value of the instrument. Although counterparties on financial instruments might expose Toyota to losses in the event of nonperformance, it did not anticipate significant losses due to the nature of its counterparties, who were mostly international financial institutions. Toyota also did not have a significant exposure to any individual counterparty. Collateral was generally not required of the counterparties.
Toyota was exposed to market risk due to changes in currency rates, interest rates and certain commodity and equity prices. In order to manage these risks, Toyota used various derivative financial instruments.
Toyota was exposed to fluctuations in foreign exchange rates, primarily the U.S. dollar and the euro and to a lesser extent the British pound. Toyota’s consolidated financial statements, which were presented in Japanese yen, were affected both translation and transaction risk.
Translation risk was the risk that Toyota’s financial statements for a particular period or for a particular date would be affected by changes in the prevailing exchange rates of the currencies in those countries in which Toyota did business against the Japanese yen. The translation effect was a reporting consideration and did not reflect Toyota’s underlying results of operations. Toyota did not hedge translation risk.
Transaction risk was the risk that the currency structure of Toyota’s costs and liabilities might not match the currency structure of sales proceeds and assets. Transaction risk related primarily to sales proceeds from Toyota’s non-domestic sales produced in Japan and, to a lesser extent, sales proceeds from Toyota’s continental European sales produced in the United Kingdom.
Toyota believed that the location of its production facilities in different parts of the world had significantly reduced the level of transaction risk. Toyota had localized much of its production by constructing production facilities in the major markets in which it sold its vehicles. In 2002, Toyota produced 56% of its overseas sales. In North America, 58% of vehicles sold in 2002 were produced locally. In Europe, 43% of vehicles sold in 2002 were produced locally. Local operations permitted Toyota to purchase locally and match the currencies of local revenues with those of local expenses. Toyota also entered into currency borrowings and other hedging instruments to address a portion of its transaction risk.
Generally, a weakening of the Japanese yen against other currencies had a positive impact on Toyota’s revenues, operating income and net income. A strengthening of the Japanese yen against other currencies had the opposite effect. The Japanese yen had on average been stronger against the U.S. dollar during fiscal 2003 and 2001 but was weaker during 2002. At the end of fiscal 2003, 2002 and 2001, the Japanese yen was stronger, weaker and weaker, respectively, against the U.S. dollar in comparison to the end of the prior fiscal year. During the first quarter of fiscal 2004, the Japanese yen was stronger against the U.S. dollar, on an average, compared to fiscal 2003, and was particularly stronger, on an average, compared to the first quarter of fiscal 2003. The Japanese yen had on an average been weaker against the euro during fiscal 2003 and fiscal 2002 and stronger against the euro during fiscal 2001. At the end of each of fiscal 2003, 2002 and 2001, the Japanese yen was weaker against the euro in comparison to the end of the previous fiscal year.
Toyota had foreign currency exposures related to buying, selling and financing in currencies other than the local currencies in which it operated. Toyota’s most significant foreign currency exposures related to the United States and Western Europe.
Toyota used a value-at-risk analysis (VaR) to evaluate its exposure to changes in foreign exchange rates. VaR indicated the maximum losses that would occur for a given probability. The VAR was estimated by using a Monte Carlo Simulation method and assumed a 95% confidence level on the realization date and a 10-day holding period. The VaR of the combined foreign exchange position was an estimated potential loss in pre-tax earnings of ¥24.0 billion as on March 31, 2002 and ¥29.5 billion as on March 31, 2003. Based on Toyota’s overall currency exposure (including derivative positions), the risk during the year ended March 31, 2003 to pre-tax cash flow from currency movements was on average ¥25.7 billion, with a high of ¥29.5 billion and a low of ¥22.2 billion.
Toyota was subjected to market risk due to changes in interest rates. Toyota used various financial instruments to deal with interest rate fluctuations and to minimize interest expense. Certain exchange traded futures and options contracts, interest rate caps and floors, along with various investments, were used to reduce the interest rate risk related to these activities. The potential decrease in fair value resulting from a hypothetical 100 basis point upward shift in interest rates was estimated to be ¥28.3 billion as on March 31, 2002 and ¥23.1 billion as on March 31, 2003. There were certain shortcomings inherent in the sensitivity analyses presented. The model
assumed interest rate changes were instantaneous parallel shifts in the yield curve. In reality, changes were rarely instantaneous. Although certain assets and liabilities might have similar maturities or periods to re-pricing, they might not react correspondingly to changes in market interest rates. Also, the interest rates on certain types of assets and liabilities might fluctuate with changes in market interest rates, while interest rates on other types of assets might lag behind changes in market rates.
Finance receivables were less susceptible to prepayments when interest rates changed. Toyota’s model did not address prepayment risk for automotive related finance receivables. In the event of a change in interest rates, actual loan prepayments might deviate significantly from the assumptions used in the model.
Commodity price risk was the uncertainty arising out of changes in the prices of commodities, such as non-ferrous (e.g., aluminum), precious metals (e.g., palladium, platinum and rhodium) and ferrous alloys (e.g., steel), which Toyota used in the production of motor vehicles. Toyota did not use derivative instruments to hedge commodity price risk. It generally managed the risk by holding minimum stock levels.
Toyota held investments in various available-for-sale securities, whose prices fluctuated. The fair value of 2available-for-sale securities was approximately ¥564.4 billion as on March 31, 2002 and the fair value of available-for-sale securities was approximately ¥487.6 billion as on March 31, 2003. The potential change in the fair value of these investments, assuming a 10% change in prices, was estimated to be ¥56.4 billion as on March 31, 2002 and ¥48.8 billion as on March 31, 2003.
Toyota employed derivative financial instruments, including foreign exchange forward contracts, foreign currency options, interest rate swaps, currency swap agreements and interest rate options to manage its exposure to fluctuations in interest rates and foreign exchange rates. Toyota did not use derivatives for speculation or trading purposes. Changes in the fair value of derivatives were recorded each period in current earnings or other comprehensive income (OCI), depending on whether a derivative was designated as part of a hedge transaction and the type of hedge transaction. The ineffective portion of all hedges was recognized in current earnings.
Toyota adopted FAS No. 133, Accounting for Derivative Instruments and Hedging Activities, as amended, on April 1, 2001. Upon adoption of this statement, Toyota recorded a net transition adjustment gain of ¥8,986 million, net of income tax expense of ¥4,967 million, in net income, and a net transition adjustment loss of ¥2,451 million, net of income tax benefit of ¥1,453 million, in accumulated OCL (Other Comprehensive Loss).
Other comprehensive income and loss (OCI/L) changed by ¥352.2 billion to a loss of ¥337.0 billion during fiscal 2003 compared with the prior year. This change resulted primarily from a decrease in a foreign currency translation adjustments during fiscal 2003 to a loss of ¥139.3 billion compared to a gain of ¥133.9 billion in the prior year, an increase in minimum pension liability adjustments during fiscal 2003 to ¥172.0 billion compared to ¥114.3 billion in the prior year and an increase in unrealized holding losses on securities during fiscal 2003 to ¥26.5 billion compared to ¥3.6 billion in the prior year. OCL changed by ¥172.3 billion, to an income of ¥15.2 billion
during fiscal 2002 compared with the prior year. This change resulted primarily from a decrease in an unrealized holding losses on securities during fiscal 2002 to ¥3.6 billion ( ¥305.0 billion in 2001) and was partially offset by an increase in OCL to ¥114.3 billion relating to minimum pension liability adjustment (¥13.4 billion in 2001) and a decrease in a foreign currency translation adjustments gain during fiscal 2002 to ¥133.9 billion ( gain of ¥161.3 billion in 2001).
As on March 31, 2001, Toyota had a 49.9% ownership interest in The Chiyoda Fire and Marine Insurance Company (“Chiyoda”), which was accounted for using the equity method of accounting, and a 19.3% ownership interest in Dai-Tokyo Fire and Marine Insurance Company Limited (“Dai- Tokyo”), which was treated as a marketable security. On April 1, 2001, Chiyoda and Dai-Tokyo merged with Dai-Tokyo being the surviving corporation and Dai-Tokyo changed its name to Aioi Insurance Co., Ltd. (“Aioi”). Toyota’s ownership interest in Aioi after the merger was 33.4%. Toyota accounted for its ownership in Aioi using the equity method of accounting.
Fair value hedges
Fair Value hedge protected Toyota from changes in the fair value of a recognized asset or liability. An example of a fair value hedge was a hedge of exposure to changes in the fair value of fixed interest debt as a result of changes in interest rates. Either the issuer or the holder could enter into such a hedge.
The gain or loss from re-measuring the hedging instrument at fair value had to be recognized immediately in net profit or loss. The loss or gain on the hedged item attributable to the hedged risk had to be (a) applied as an adjustment to the carrying amount of the hedged item, and (b) recognized immediately in net profit and loss. This applied to both hedged available-for-sale items, for which the normal policy was to recognize gains and losses from remeasurements at fair value directly in equity, and to items that were otherwise measured at cost. If, however, only certain risks attributable to a hedged item had been hedged, recognized changes in the fair value of the item unrelated to the hedge were accounted for in accordance with the enterprise's normal accounting policy for the item.
Toyota used swaps mainly to convert its fixed-rate debt to variable rate debt. Toyota used interest rate swap agreements as part of specific debt transactions or on a portfolio basis. Toyota used currency swap agreements to hedge exposure to exchange rate fluctuations on principal and interest payments for borrowings denominated in foreign currencies. Notes and loans payable issued in foreign currencies were hedged by swap agreements which involved the exchange of foreign currency principal and interest obligation for each functional currency obligation at agreed-upon currency and interest rates.
For the years ended March 31, 2002 and 2003, Toyota reported losses of ¥625 million, and ¥488 million ($4 million), respectively, related to the ineffective portion of Toyota’s fair value hedges. This was included in the cost of financing operations in the accompanying consolidated statements of income. For fair value hedging relationships, the components of each derivative’s gain or loss were included in the assessment of hedge effectiveness.
Cash flow hedges
Cash Flow hedge was not used to protect Toyota from variability in cash flows in case of (i) a recognized asset or liability, or a forecasted transaction, such as an anticipated purchase or sale. A hedge of a firm commitment (unrecognized in the balance sheet) to buy or sell an asset in the enterprise’s reporting currency was accounted for as a cash flow hedge even though it was actually a fair value exposure. Examples of cash flow hedges were: a hedge of a future currency risk arising from a contractual, commitment by an airline (unrecognized in its balance sheet) to purchase an aircraft for a fixed amount of foreign currency or use of an interest rate swap to convert, effectively, floating rate debt to fixed rate debt.
That portion of the gain or loss on the hedging instrument that was determined to be an “effective hedge” had to be recognized directly in equity. The component of equity associated with the hedged item had to be adjusted to the lower of (a) the fair value of the cumulative change in expected future cash flows of the hedged item from the inception of the hedge, and (b) the cumulative gain or loss on the hedging instrument needed to offset the cumulative change in expected cash flows of the hedged item from the inception of the hedge. Any remaining gain or loss on the hedging instrument constituted the ineffective portion and had to be reported (a) if the
hedging instrument was a derivative, immediately in net profit or loss, and (b) if the hedging instrument was not a derivative, in accordance with the requirements for reporting fair value remeasurement gains and losses for the type of instrument involved.
Toyota used swaps to manage its exposure to interest rate risk, and foreign exchange risk. Interest rate swap agreements were used in managing Toyota’s exposure to the variability of interest payments due to the changes in interest rates arising principally in variable-rate debt issued by Toyota. Interest rate swap agreements, qualified as cash flow hedges were executed as an integral part of specific debt transactions. Toyota used currency swaps to manage the foreign currency exposure to variability in functional-currency equivalent cash flows, principally from debt or borrowing denominated in currencies other than functional currencies.
Net derivative gains and losses included in OCI were reclassified into earnings at the time that the associated hedged transactions had an impact on the income statement. For the years ended March 31, 2002 and 2003, net derivative gains of ¥4,762 million and losses of ¥790 million ($7 million) were reclassified to foreign exchange again (loss), net in the accompanying consolidated statements of income, respectively. These net gains and losses were offset by net losses and gains from the transactions being hedged. The components of each derivative’s gain and loss were included in the assessment of hedge effectiveness. No hedge ineffectiveness was reported because all critical terms of derivative financial instruments designated as, cash flow hedging instruments were same as those of hedged debt transactions. Toyota did not expect to reclassify any gains or losses included in OCI as on March 31, 2003, into earnings in the next twelve months because no derivative instruments qualified as cash flow hedges as on that date.
Toyota used forward contracts, options and swaps to manage its exposure to currency and interest rate fluctuations where it was unable or had elected not to apply hedge accounting. Unrealized gains or losses on these derivative instruments were reported in the cost of financing operations and foreign exchange gain (loss), net in the accompanying consolidated statements of income.
Exhibit V
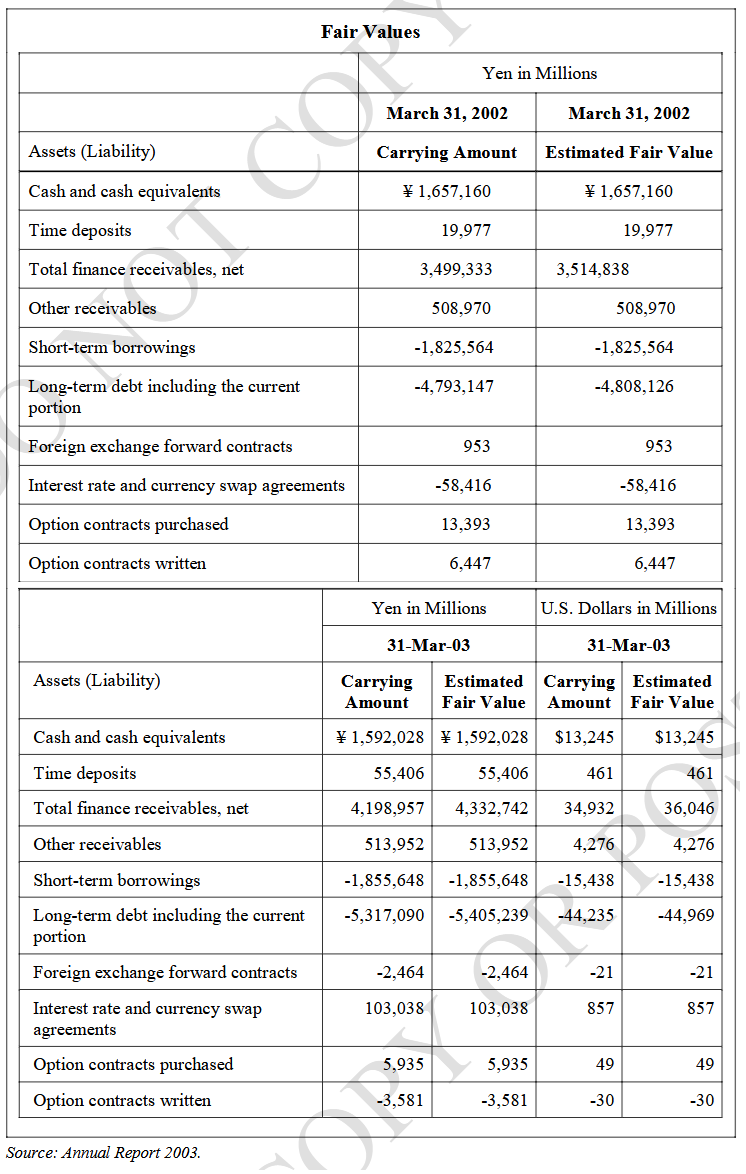 |
Accounting for Financial Instruments under US GAAP
FAS-133
With the development of new and sophisticated financial instruments, relevant accounting standards had also evolved. In case of derivative instruments, accounting was more complicated as significant periods often elapsed between execution and performance of contracts. FAS-133, the accounting standard for derivative instruments and hedging activities was issued in 1998. The effective date for the rollout of FAS-133 was delayed till June 15, 2000 by FAS-137. FAS-133 was subsequently amended by FAS-138.
FAS-133 had been formulated on the basis of a few fundamental principles. Derivative instruments essentially resulted in assets and liabilities. All derivatives needed to be shown at fair value on the balance sheet as either asset or liability. The differences in fair values had to be adjusted periodically. The method of adjustment would vary depending on whether the derivative instrument was hedging an underlying exposure or not. To be considered a hedging transaction, certain criteria had to be fulfilled. There had to be an effective hedging relationship between the item to be hedged and the accounting instrument at the initiation of the hedge and throughout the life of the hedge. A company had to define hedge effectiveness and stick to the criteria.
Derivative instruments were classified into four categories under FAS-133. No hedge, fair value hedge, cashflow hedge and foreign currency hedge. For each of these categories, FAS-133 prescribed different ways of accounting. If an instrument did not qualify as a hedge, the change in fair value had to be recognized in net income.
Fair value hedges aimed at reducing the risk of changes in value of a recognized asset or liability or an unrecognized firm commitment. In case of a fair value hedge, both at the inception and on an ongoing basis, the hedging relationship had to be effective in achieving offsetting changes in fair value attributed to the hedged risk. Such an assessment was required whenever financial statements or earnings were reported and at least every three months. Changes in value of both the derivative used for hedging and the hedged item were recognized in current earnings. Cashflow hedges aimed at reducing the variability of cash inflows & outflows. They were applied to both contractual cashflows related to an existing asset or liability and forecasted transactions. In case of a cashflow hedge, the hedging relationship aimed at offsetting cashflows attributable to the hedged risk. An assessment was required on the effectiveness of hedging when financial statements or earnings were reported and at least every three months. If a hedging instrument was used to modify cashflows on account of interest, the instrument had to establish a clear link between the underlying assets and liabilities. The effective portion of the gain or loss on a derivative designated as cashflow hedge was reported in Other Comprehensive Income (OCI). The ineffective portion was reported in earnings. Amounts in accumulated OCI were reclassified into earnings in the same period in which the hedged forecasted transaction affected earnings.
In case of a hedged item being denominated in a foreign currency, there could be three types of hedges – fair value (as explained earlier), cashflow (as explained earlier) and hedge of a net investment in a foreign operation. The change in fair value of a derivative instrument that qualified as a hedge of a net investment in a foreign operation was reported in OCI and remained as part of Accumulated OCI.
FAS-115
FAS-115 dealt with the accounting and disclosure standards for debt and equity securities. A debt security represented a creditor relationship with an enterprise. An equity security represented an ownership interest in an enterprise. FAS-115 covered investments in equity securities that had readily determinable fair values and all investments in debt securities.
FAS-115 required enterprises to classify securities into three categories: held-to maturity, trading and available-for-sale. A security qualified for held-to maturity category only if the enterprise had a clear intent and ability to hold it to maturity. Trading securities (both debt and equities) were those, held for a short period of time with the hope of gaining from the investment. Available-for- sale securities (both debt and equity) fell somewhere between these extremes.
Investments in securities classified as trading or available-for-sale had to be carried at fair value in the balance sheet. Unrealized holding gains or losses represented the net change in the fair value of a security, excluding dividend or interest income recognized but not received and any write- downs for permanent impairment. Unrealized holding gains and losses were included in earnings in case of trading securities and reported in shareholders’ equity as OCI in case of available-for- sale securities. In case of held-to maturity securities, (which applied only to debt), the cost was amortized.
FAS-107
This standard established specific disclosure requirements and procedures to be followed while estimating the fair value of financial instruments. Fair value was defined as the amount at which the instrument could be exchanged in a current transaction between willing parties, not in a forced or liquidation sale.
In general, fair value could be computed if:
1. There was a published price quotation for it in an active public securities market.
2. It was a debt instrument rated by an independent rating agency, and its cashflows could be reasonably estimated.
3. There existed an appropriate valuation model, and the data inputs required could be measured reliably because they came from active markets.
Quoted market prices, if available, were considered to represent the best value of financial instruments. Otherwise, the fair value could be estimated on the basis of quoted price of a similar instrument or by using valuation techniques. For example, the fair value of a loan could be arrived at by calculating the present value of future cashflows, using a risk adjusted discount rate.
FAS-107 disclosures did not apply in case of financial instruments covered by other pronouncements. Thus, they did not include items such as minority interests in consolidated subsidiaries and an entity’s own equity instruments included in stockholders’ equity. They did not apply to leases and warranties. They also did not apply to trade receivables and payables unless their carrying values did not reflect fair values.
FAS-119
This standard encouraged companies to disclose quantitative data about foreign exchange, interest rate, commodity price or other market risks of derivatives, consistent with the company’s risk management strategies. Various approaches to make these disclosures had been suggested.
- Information on current positions, such as time maturity profiles, contract rates, indexes and provisions of contract.
- Hypothetical changes in market prices and their impact on net income and equity.
- Gap analysis to measure interest rate risk associated with repricing of assets and liabilities at their maturity.
- Duration of financial instruments - Duration could be thought of as the life, in years, of a zero coupon bond whose fair value would change by the same amount as the real bond or portfolio in response to a change in market interest rates.
- Value at risk - This was a measure of the maximum loss a portfolio would suffer over a defined time horizon at a specified confidence level.
Keywords
Toyota Motor Corporation, Toyota, Financial risk management, Sakichi Toyoda, Camry, Corona, Corolla, Lexus, US GAAP, generally accepted accounting principles, FAS 115, Hedging, Credit risk, Market risk, MBA case study, Strategy
Related Case Studies
| Case Title | Details | Price | Add to Cart |
|---|---|---|---|
|
Case Title Options Strategies on Microsoft and Facebook Stocks (A)Case Code: FINC102 |
Details | 400 | Add to Cart |
|
Case Title Options Strategies on Microsoft and Facebook Stocks (B)Case Code: FINC101 |
Details | 600 | Add to Cart |
|
Case Title Options Strategies on Microsoft and Facebook Stocks (C)Case Code: FINC100 |
Details | 600 | Add to Cart |
|
Case Title Turnaround Story of Wockhardt LimitedCase Code: FINC086 |
Details | 600 | Add to Cart |
|
Case Title Trouble at Wockhardt LimitedCase Code: FINC084 |
Details | 500 | Add to Cart |