
A Note on Investment Strategies Involving Options
🌐 International Buyers — Pay via PayPal
Details
MISC003
18
2003
NO
300
Not Applicable
Financial Services
Global
Financial Options & Derivatives
Abstract
The note discusses some of the basic definitions often used in option contracts. It covers in detail the various investment strategies involving options, The objective of this note is to make the reader understand better the potential of options as an investment tool and how an options strategy can be designed to take advantage of certain market conditions.
Learning Objectives
The case is structured to achieve the following Learning Objectives:
- Investment strategies involving options.
Contents
Options on commodities have existed in different forms since 1860 for products including gold, wheat and tulip bulbs. However, large-scale manipulation by intermediaries and absence of standardized contracts resulted in investors incurring heavy losses due to which trading in commodity options were discontinued by many exchanges by 1968. But today options have become one of the most preferred derivative instruments among the investors.
Until 1973, trading in options on stocks was cumbersome as the contract was between the buyer and the seller, and the stock exchange played no major role. In 1973, options on stocks were traded for the first time in an organized stock exchange1. The exchange also became a party to these contracts. Since then, there has been a significant growth in the options market with options being traded in several exchanges all over the world.
An option is the right, but not an obligation, to buy or sell a specific commodity on or before a specific date for a specific amount. Options are of two basic types – Call and Put. A call option gives the option holder the right, but not an obligation, to buy a given amount of an underlying asset on or before a certain date for a specified price. However, the seller of the option is under an obligation to fulfill the contract for which a price is paid by the call option holder, which is known as call option premium. A put option gives the option holder the right to sell a given amount of an underlying asset on or before a certain date at a specified price. The seller of the option is under an obligation to fulfill the contract and is paid a price known as the put option premium. An option contract may involve taking a ‘long position’ or a ‘short position’ or both. An investor is said to have taken the long position when he/she has bought an option. On the other hand, an investor is said to have taken a short position when he/she has sold or written the option.
While discussing option contracts, it is important to understand some other terms that are often used. Strike or Exercise Price is the price at which the underlying asset would be bought at a particular date in the future. The date on which the option holder exercises his right to sell/buy the option is known as the Exercise Date while the date on which the option expires is known as Expiration Date.
Options can be categorized further according to the date of exercise. A European Option can be exercised only on the maturity date while an American Option can be exercised before or on the maturity date. A Bermudan Option is a combination of the American and European option and is exercisable only on certain specified days during its entire life. In Cash settled option buyer is paid the difference between the stock price and the exercise price (in the case of a call option) or between the exercise price and the stock price (in the case of a put option). In a Delivery settled option buyers take the delivery of the underlying security (in the case of a call option) or offers the delivery of the underlying security (in the case of a put option).
Options can be used by an investor to create a wide range of payoff functions. They help in achieving unique risk-return patterns, which cannot be achieved by taking investment positions in underlying assets. In this concept note, we illustrate in detail the various investment strategies using options.
Let us consider a typical option transaction. On April 1, 2002, a person A sells a three-month Rs.500 European call option on shares of Britannia, which is currently trading at Rs. 470 to B for a price of Rs.3.25. Now B has the right to approach A on July 01, 2002 and buy one share of Britannia at Rs.500. In the transaction, Rs 3.25 is the ‘option premium,’ Rs.500 is the ‘exercise price’ and July 01, 2002 is the ‘expiration date.’
It is not necessary for B to buy the share on July 01, 2002 at Rs.500 from A (unlike a forward/futures contract, which is binding on both sides). It is only if Britannia’s share price is more than Rs.500, on July 01, 2002, that B will find it useful to exercise his right to buy. If B chooses to exercise the option, A is obliged to honor the deal. In that case, A will have to sell a share of Britannia to B at Rs. 500 on the same day.
Hence, at option expiration, there can be two possible outcomes – an option could be profitably exercised, or it could be allowed to expire being unused. If the option lapses unused, then B has lost the option premium of Rs.3.25 to A.
An option can be referred to as in the money, at the money, or out of the money. An ‘in the money’ option is one which yields a positive cash flow to the option holder when exercised. An ‘at the money’ option would lead to a zero cash flow when exercised while ‘out of the money’ option would lead to a negative cash flow if it is exercised immediately. If X is the stock price and Yt is the strike price, a put option is in the money when X < Yt, at the money when X = Yt and out of the money when X > Yt (Refer Table 1).
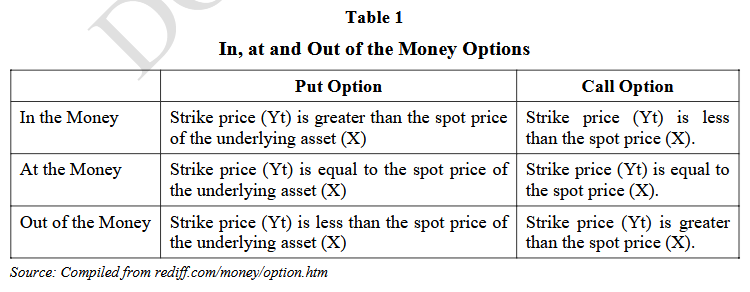 |
For example, a put option on stock A at an exercise price of Rs. 500 is ‘in the money’ when the stock at the expiration date is trading below Rs. 500 because the put holder can exercise the option and realize an amount which is greater than the current spot price.
Let us understand the basics of call option with the help of the following example:
Example:
A buys a European call option on a share of Philips at a premium of Rs. 3 per share on October 01, 2002. The strike price is Rs.65 and the contract matures on December 31, 2002. The payoff table (Refer Table 2) shows the payoffs for the investor on the basis of the different spot prices at any given time. It is also clear from the graph that in the worst possible case, A would only lose a maximum of Rs.3 per share, which has been paid as an option premium. However, the upside to it is that he has an unlimited profit opportunity.
On the contrary, the seller of the call option has a payoff chart, completely reverse to that of the call options buyer. In this case, the maximum profit a seller gains will be Rs.3 per share, while the losses suffered would be unlimited.
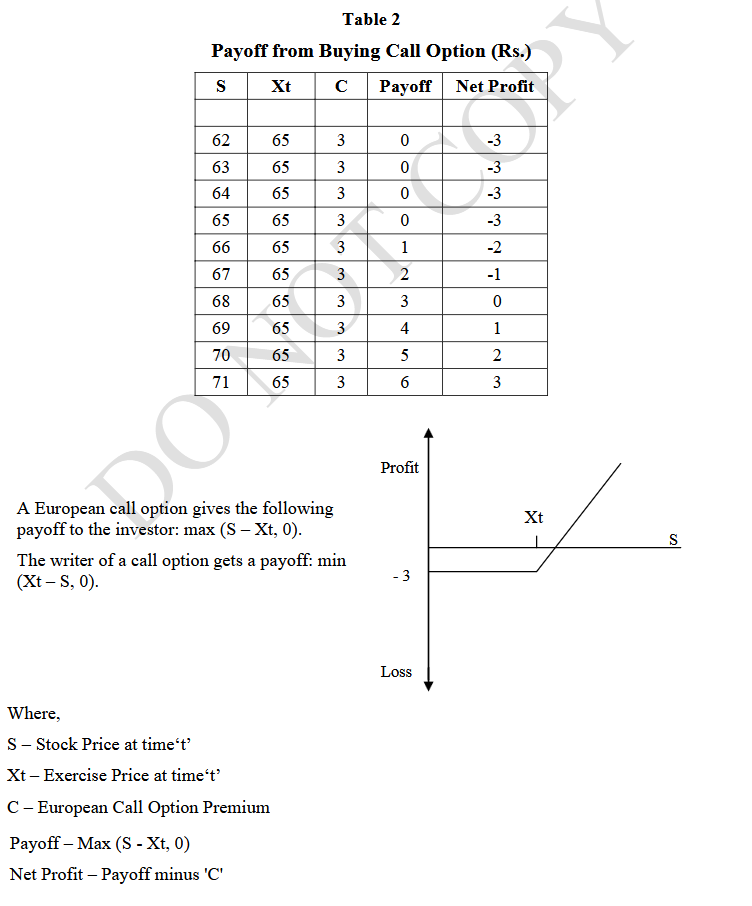 |
In the above example, we can infer that the buyer of the call option would exercise his option only when he makes profit. If the spot price is lower than the strike price, it would be profitable for A to buy the share in the open market and forgo the premium paid.
Investors buy call options when they feel that the stock market will rise significantly in the short term. However, if a shareholder feels that his/her shares are not expected to rise in the short-term, he can earn a premium by selling a call option on that share. The payoff diagram will be completely opposite to that of an investor when he/she is long on call.
Example:
A sells a European call option on a share of LG Electronics at a premium of Rs. 3 per share on January 01, 2002. The strike price is Rs.65 and the contract matures on June 30, 2002. The payoff table (Refer Table 3) shows the payoffs for A on the basis of different spot prices at maturity of the option. It is clear from the graph that the upside potential is limited to a maximum of Rs.3 per share, which has been received as option premium. However, the downside risk is unlimited and the investor may experience huge losses, if the market does not move according to his expectations.
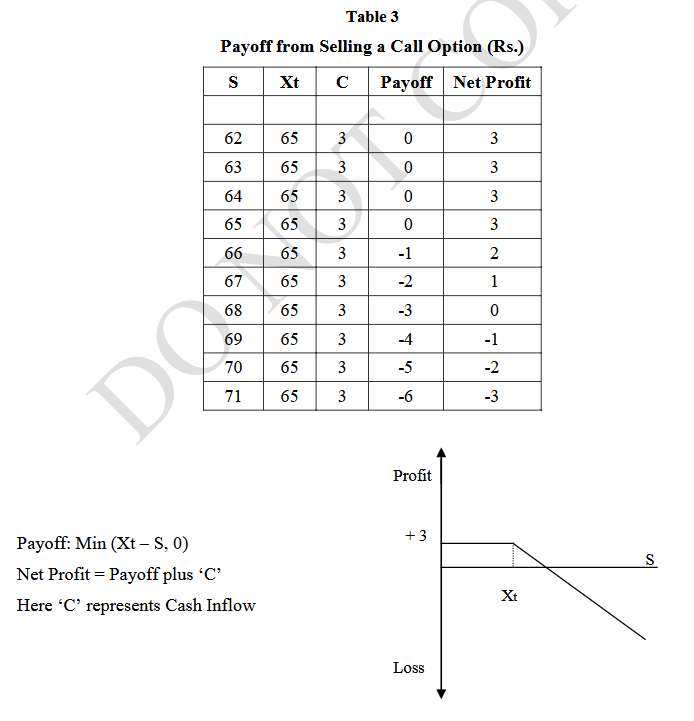 |
Investors adopt this strategy when they are certain that the market will not rise, but are not sure whether it will fall or not. This strategy should be used carefully because an investor may incur losses if the market suddenly enters a bullish phase.
Put Options:
The European put option is the reverse of a call option deal. Let us understand the basics of put option with the help of the following example:
Example:
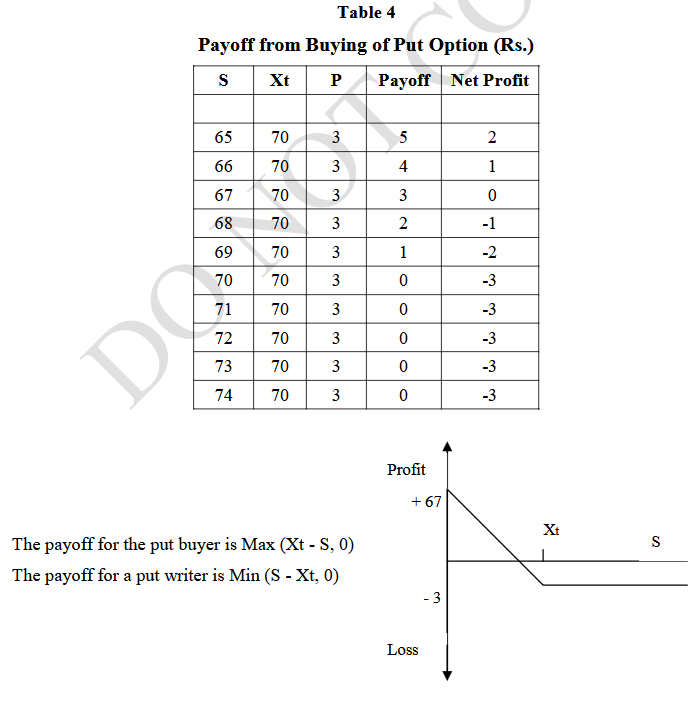
B buys a European put option on a share of Philips at a premium of Rs. 3 per share on October 31, 2002. The strike price is Rs.70 and the contract matures on December 31, 2002. The payoff table (Refer Table 4) shows the fluctuations of profit with a change in the spot price. Investors may buy put options when they feel that the market will fall significantly in the near future. In this case, the upside potential is maximum at the point when S falls to zero while the downward risk is limited to the premium paid.
On the other hand, the seller of the put option has a payoff chart completely reverse to that of the put options buyer. The loss that he can incur is more significant (Xt – P) but the profit potential is limited to the amount of premium received. An investor adopts this strategy when he is sure that the market will not fall but is unsure whether it will rise or not.
 |
Example:
B sells a European put option on one share of BPL Engineering at a premium of Rs. 3 per share on January 01, 2002. The strike price is Rs.70 and the contract matures on June 30, 2002. The payoff table (Refer Table 5) shows the fluctuations of profit with a change in the spot price.
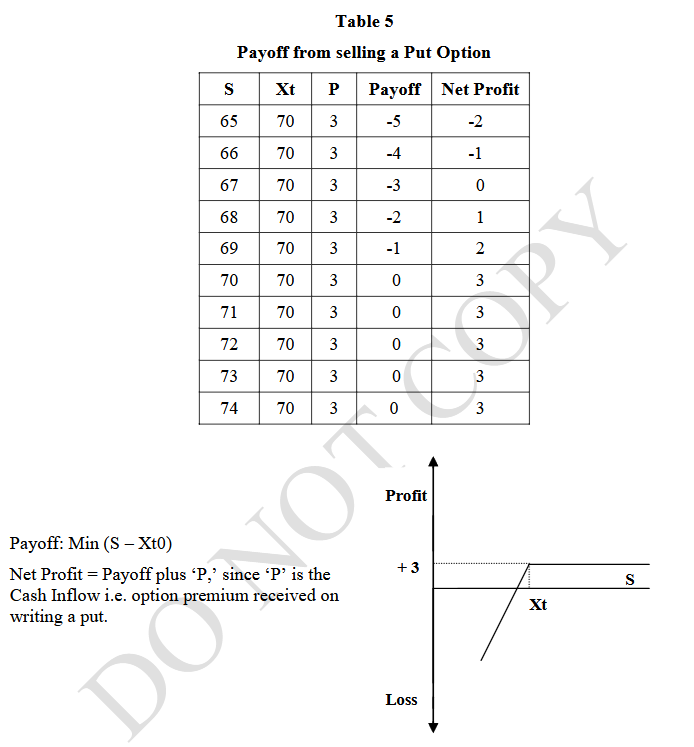 |
Investors adopt this strategy when they are certain that the market will not fall. If they expect the market to be very bullish, they will sell a put, which is in the money. The four option trading strategies mentioned above (long a call, short a call, long a put and short a put) can be used independently, together, or in combination with other financial instruments to develop a number of option-trading strategies.
Using options one can design unique investment strategies and take the advantage of the market fluctuations. The other investment strategies involving options include spreads, straddles, strips, straps, and strangles.
Spreads
A spread investment strategy involves taking a position in two or more options of the same type, which can be either two or more calls or two or more puts.
A spread, which is designed to earn profits for the investor in case of a price rise, is known as bull spread. A bull spread using call options can be created by buying a call option with a lower strike price and selling a call option with a higher strike price. However, it is important to note that both options must have the same expiration date.
Example:
An investor buys one June call option on a share of Philips at a premium of Rs 58 per share and a strike price of Rs.270 (X1). He also sells one June call option on a share of Philips at a premium of Rs. 8 and a strike price of Rs. 350 (X2). The payoff table (Refer Table 6) shows the fluctuations in net profit with the change in spot prices.
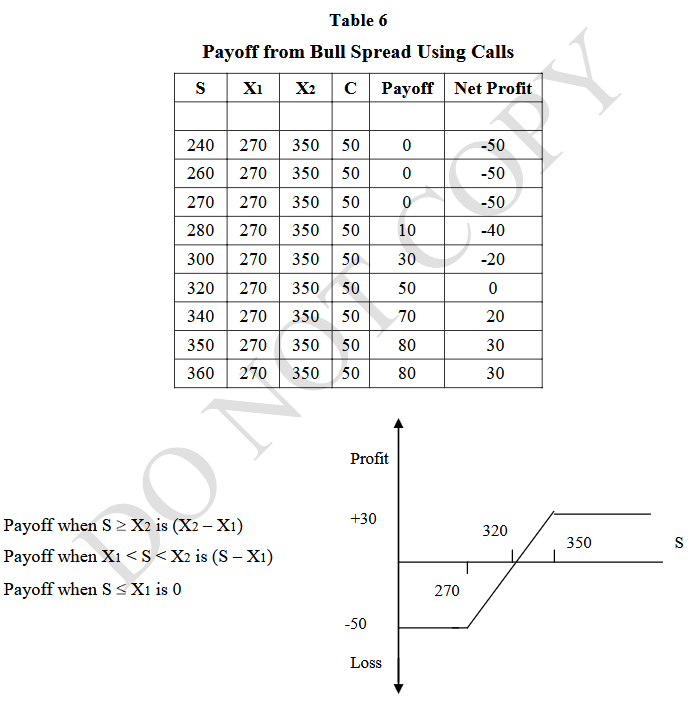 |
A bull-spread strategy limits both the investor’s upside potential as well as the downward risk. It is a conservative strategy adopted by investors who feel that the market is more likely to rise than fall, but wish to limit their downside risk. A bull spread can also be created using put options where a put is bought at a lower strike price and sold at a higher strike price. In this case, the upside potential is limited to the amount of net option premium while the downside risk is limited to the difference between the strike price and the net option premium.
A spread designed in such a way so as to yield profit even if the price falls is known as the bear spread. A bear spread using call options can be created by buying a call option with a higher strike price and selling a call option with a lower strike price. Both options have the same expiration date. A bear spread created by using calls involves an initial cash inflow since the value of the option sold is always greater than the value of the option bought, since the call price i.e. premium always decreases as exercise/strike price increases.
Example:
An investor buys one October call option on a share of ABB at a premium of Rs. 12 per share. The strike price is Rs.350 (X2). He also sells an October call option on a share of ABB at a premium of Rs. 71 and a strike price of Rs. 270 (X1). The payoff table (Refer Table 7) shows the fluctuations of net profit with a change in the spot price.
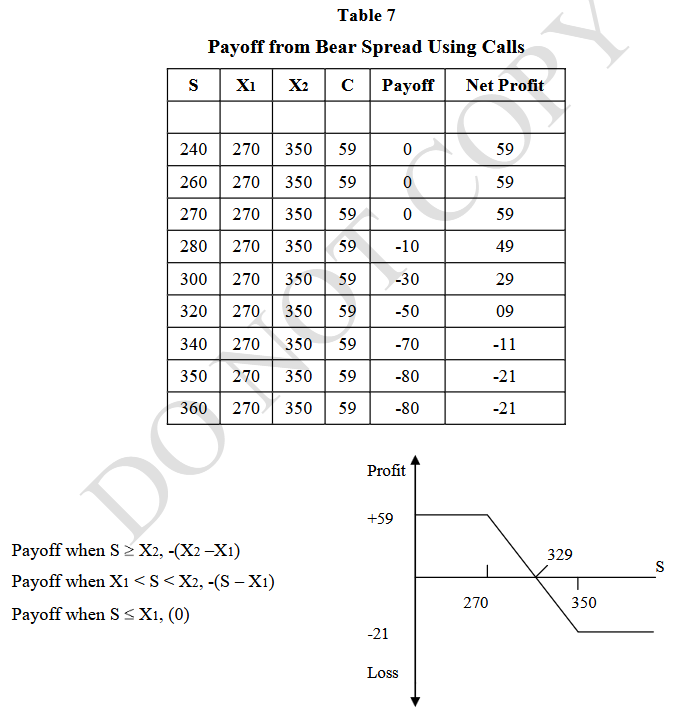 |
Similar to the bull spread, a bear spread strategy limits both the upside potential as well as the downward risk. Investors adopt this strategy when they feel that the market will not rise and they want to limit their downside risk. A bear spread can also be created using put options by buying a put with a higher strike price and selling a put with a lower strike price, but using puts will involve an initial investment. In this case, the upside potential is limited to the difference between the strike prices and the net option premium while the downside risk is limited to the amount of net option premium.
A butterfly spread is an option strategy involving four options of the same type, having the same expiration date but three different exercise prices. A butterfly spread can be created by buying an option each at two extreme strike prices (X1 and X3) and selling two options with a strike price (X2), which is halfway between X1 and X3. The strike price should be so chosen that X1 < X2 < X3. Generally, X2 should be close to the prevalent market price.
Example:
An investor buys two March call options on shares of Reliance, one at a premium of Rs. 25 per share with a strike price of Rs.200 (X1) and the other at a premium of Rs. 15 per share with a strike price of Rs. 300 (X3). The investor also sells two March call options at a premium of Rs. 17 per share with a strike price of Rs. 250 (X2). The payoff table (Refer Table 8) of a butterfly spread using calls will be:
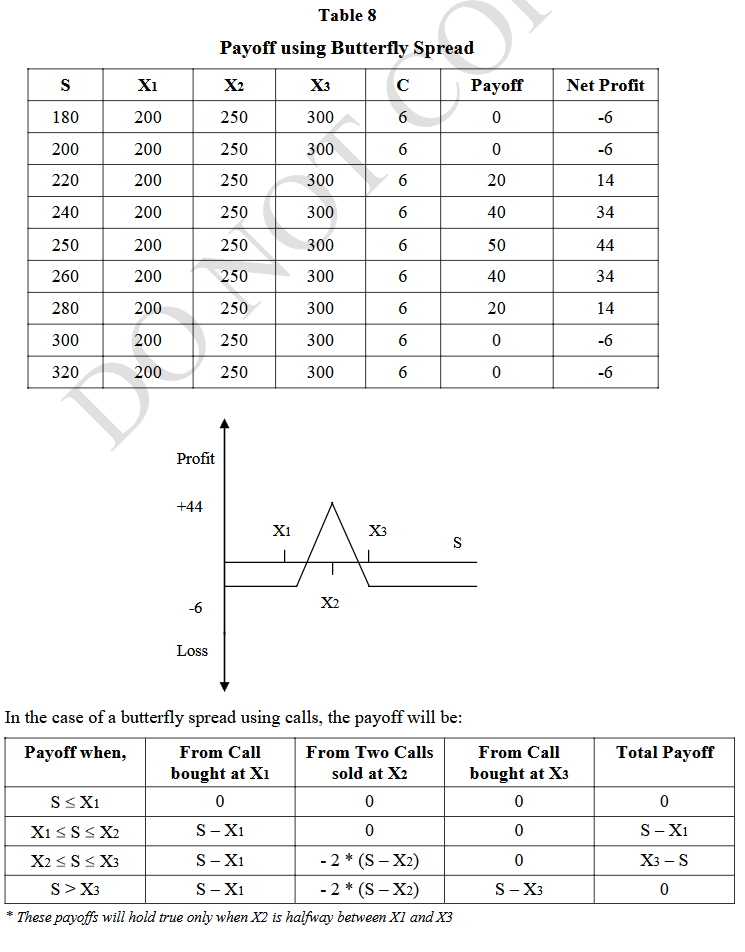 |
Investors adopt the butterfly spread strategy when they are certain that the prices will fluctuate significantly and want to limit their downside risk. This strategy limits both the upside potential as well as the downside risk. The upside potential is limited to the difference between (the middle exercise price and the lower exercise price) less the net option premium while the downside risk is limited to the amount of net option premium paid to create the spread.
Condor Spread
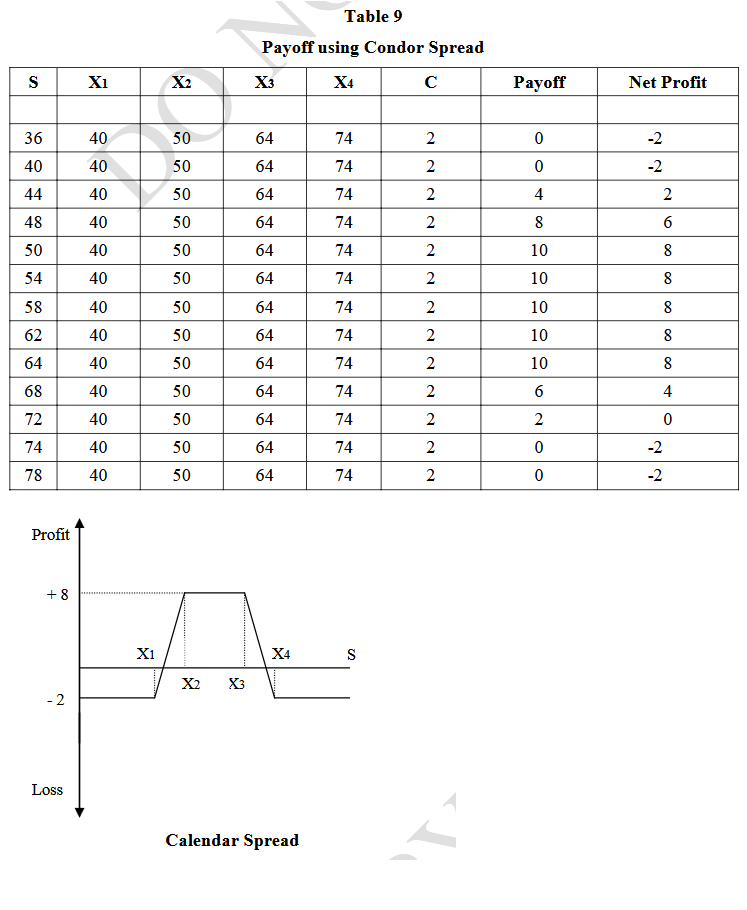
A condor spread trading strategy involves the use of four options with the same expiration date. A condor spread is similar to a butterfly spread, the only difference being that unlike the latter, all the four options in it have different exercise prices. To create a condor spread two options are to be bought at the extreme exercise prices and two are sold at two different halfway prices. Both the upside potential and the downside risk in this strategy are limited.
Example:
A buys two March call options on shares of Andhra Bank, one at a premium of Rs. 8 per share with a strike price of Rs.40 (X1) and the other at a premium of Rs. 2 per share with a strike price of Rs. 74 (X4). A also sells two March call options one at a premium of Rs. 5 per share with a strike price of Rs. 50 (X2) and the other at a premium of Rs. 3 per share with a strike price of Rs. 64 (X3). The payoff table (Refer Table 9) of a long condor spread will be:
 |
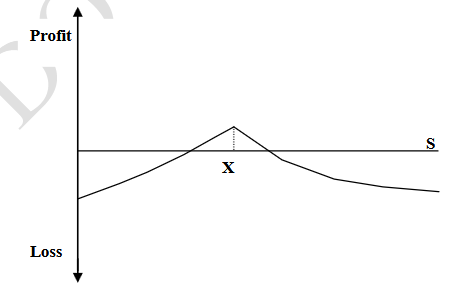
In a calendar spread, options have the same exercise price but different expiration dates. A long calendar spread can be created by using call or put options. In this case, an investor buys a call or put option with a long-term maturity with a certain exercise price and sells a short-term maturity call or put option at the same exercise price. A long calendar spread requires an initial investment, as longer the term of maturity of an option, the more valuable it is. A calendar spread is so designed to take advantage of the time decay, wherein the option closer to maturity loses its value at a much greater rate as it approaches the expiration date than the option with a longer term to maturity. This is because options closer to maturity are more volatile than an option with a long term for maturity. A short calendar spread also known as the reverse calendar spread is the opposite of the long calendar spread. Here, an investor buys a short maturity option and sells a long maturity option.
Example:
An investor buys one June call option on a share of Reliance at a premium of Rs. 25 and a strike price of Rs.240 (X) and sells a March call option at a premium of Rs. 15 at a strike price of Rs. 240 (X). The payoff diagram of a calendar spread using calls is given below: Investors make profit if the stock price at the expiration of the short maturity option is close to the exercise price. However, a loss is incurred if the stock price is lower or higher than the exercise price.
 |
Options can be used in combinations to design investment strategies that suit the risk-return profile of investors. It involves taking position in both calls and puts on the same stock. By using various combinations of options, one can develop straddles, strangles, strips and straps. These have been explained below:
Straddles
A Straddle strategy involves buying a call and a put option at same strike price and with the same expiration date. A long straddle involves buying a call and a put option at the same exercise price, for the same period and with the same underlying terms. A short straddle is the reverse of a long straddle and involves selling a call and a put option at the same exercise price and on the same expiration date.
Example:
An investor buys one March call option on a share of ABB at a premium of Rs. 21 per share at a strike price of Rs.310 (Xt). He/she buys one put option on a share of ABB at a premium of Rs. 42 at a strike price of Rs. 310 (Xt). The payoff table (Refer Table 10) shows the fluctuations of net profit with a change in the spot price.
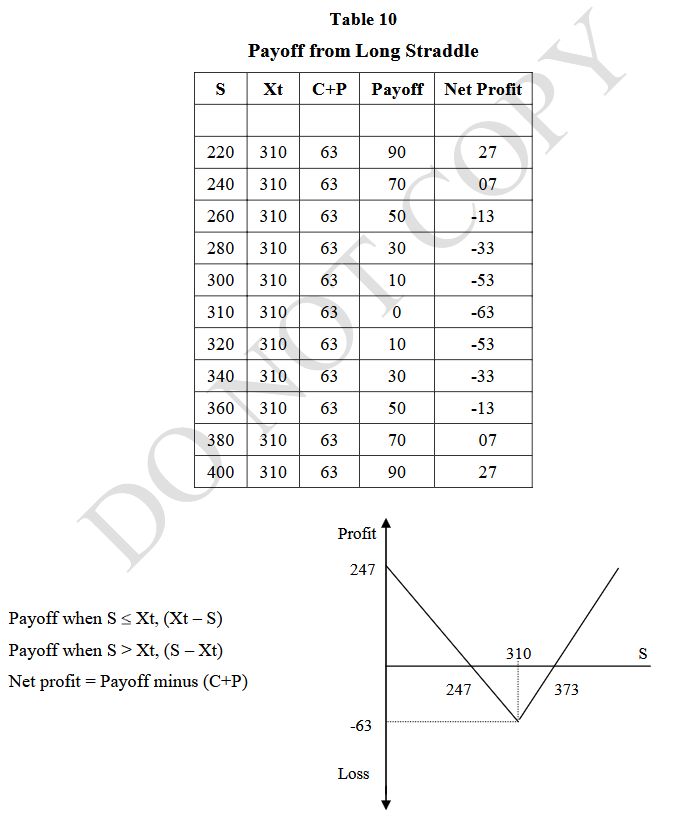 |
A long straddle strategy is likely to appeal to an investor, who expects prices to be volatile but is unclear about the direction of price change. A long straddle strategy has unlimited upside potential and limited downside risk while the short straddle strategy has unlimited risk and limited profit potential. The payoff diagram of a short straddle would be exactly the reverse of a long straddle.
A strangle is a combination of a call and a put with the same expiration date but different exercise prices. A strangle is generally chosen in such a way that the call strike price (X2) is higher than the put strike price (X1). A long strangle strategy involves buying a call and put option of the same month on the same stock. A short strangle strategy involves writing a call and put option of the same month on the same stock.
Example:
An investor buys a May call option on a share of Ranbaxy Laboratories at a premium of Rs. 21 per share at the strike price of Rs.310 (X2). He also buys one May put option on a share of Ranbaxy at a premium of Rs. 2 at a strike price of Rs. 270 (X1). The payoff table (Refer Table 11) shows the fluctuations of net profit with a change in the spot price.
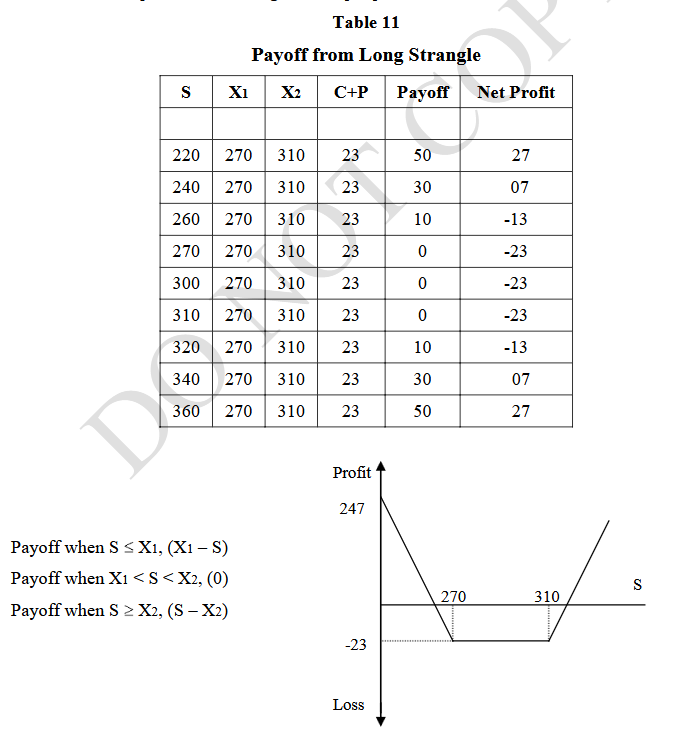 |
Investors are likely to use strangle as a strategy when they expect prices to be volatile. The strategy is similar to a long straddle but the premium paid in this strategy is less. The upside potential in this strategy is unlimited while the downside risk is limited to the amount of premium paid on the two options. Assuming that the market price falls to zero, the profit will be Rs. 247. The payoff diagram of a short strangle would be exactly the reverse of a long strangle.
A strip consists of buying one call and two puts at the same strike price and with the same expiration date. Investors use this strategy when they expect high volatility in the movement of stock prices and the prices are more likely to fall than rise.
Example:
An investor buys an August call option on a share of Knoll Pharma at a premium of Rs. 18 per share at a strike price of Rs.325 (Xt). Two August put options are also bought by him on shares of Knoll at a premium of Rs. 38 per share and at a strike price of Rs. 325 (Xt). The payoff (Refer Table 12) of an investor using strip would be:
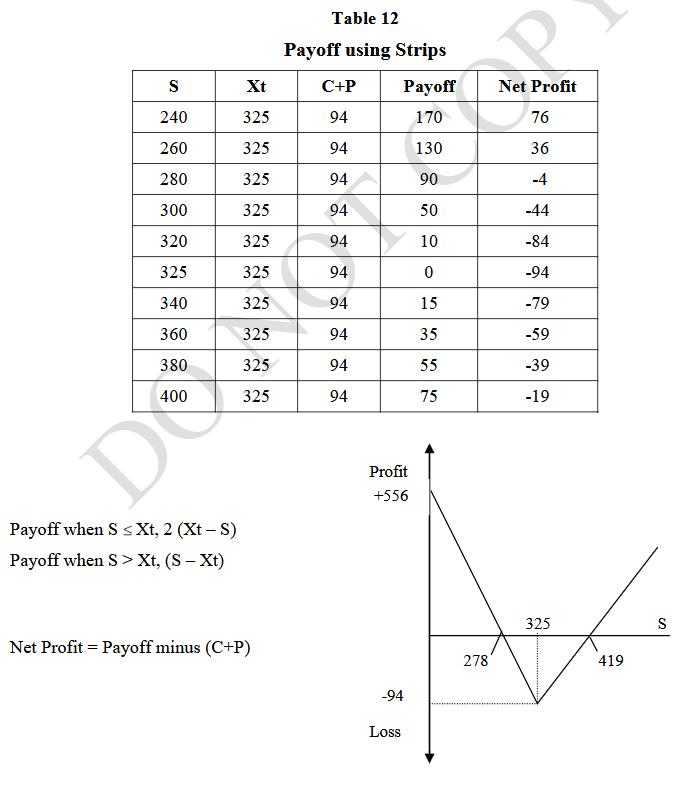 |
In a strip, the investor expects that there will be major stock price movement and the movement is more likely to be in the downward direction. By employing this strategy an investor will make profit in both the rise and fall of stock prices but the amount of profit will be greater when the prices fall sharply. The downside risk is limited to the amount of premium paid.
A strap consists of buying two calls and one put at the same strike price and with the same expiration date. A strap is like a strip, the only difference being that the investor expects volatility in the movement of stock prices and the chances of prices rising are greater.
Example:
An investor buys two October call options on shares of Knoll Pharma at a premium of Rs. 18 per share at a strike price is Rs.325 (Xt). He also buys one October put option on one share of Knoll at a premium of Rs. 38 per share and a strike price of Rs. 325 (Xt). The payoff (Refer Table 13) of an investor-using strap would be:
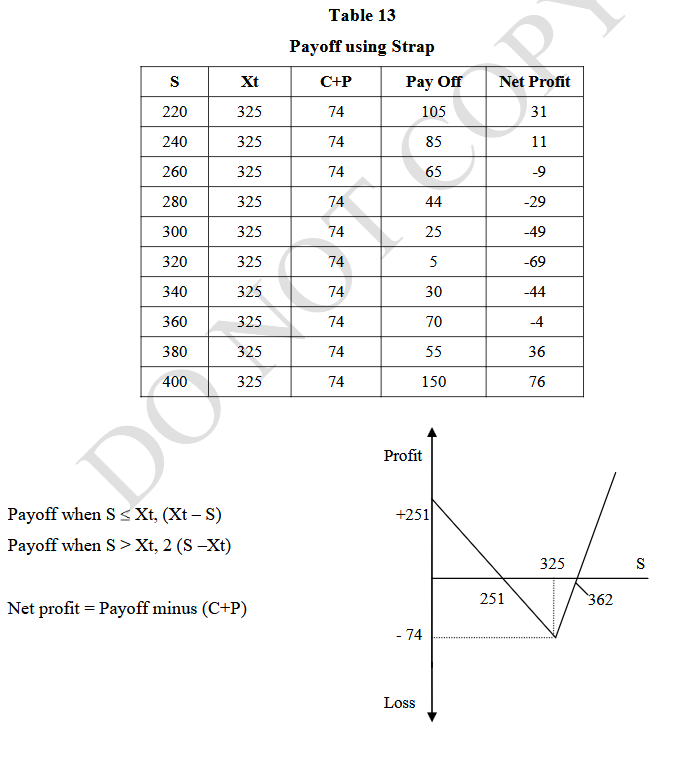 |
In this case, investors make profit when prices are significantly lower or higher than the current market price. The profit will be more when the rise in price of stock is huge as is also evident from the payoff diagram.
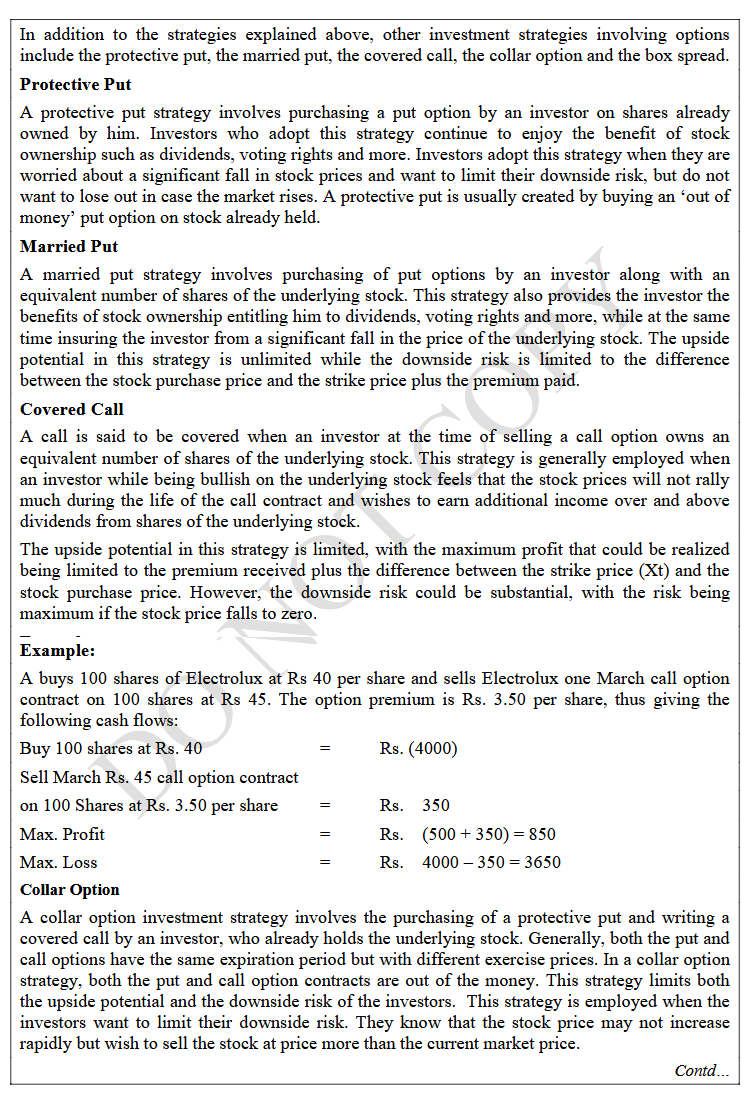
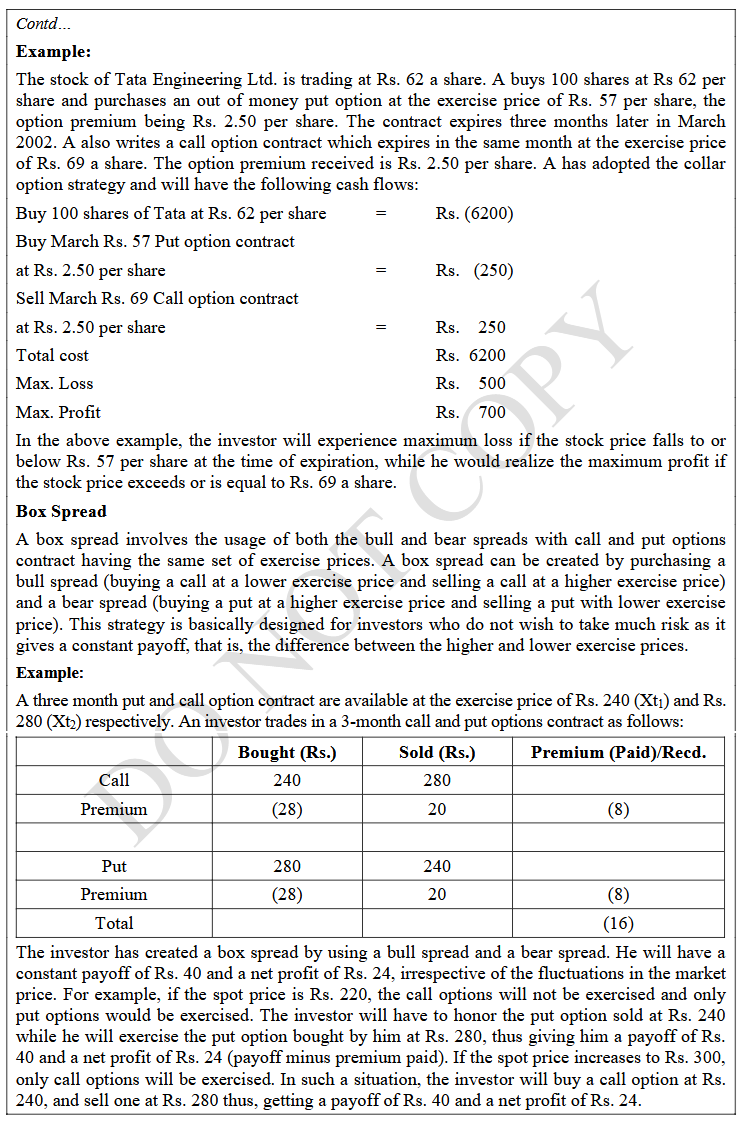
This concept note deals in detail with the important investment strategies using options and explains how an investor can make profits not only from a rise in stock prices but also when the prices fall. If used judiciously, options can prove to be useful tools to hedge positions in shares. Moreover, buying an option involves a lower cost then actually acquiring the shares. However, options as an investment strategy is highly complex requiring a close watch and more than a basic knowledge of stock markets. Some other commonly used investment strategies have been described in Exhibit I.
Exhibit I
 |
 |
Keywords
Basic definitions, option contracts, investment strategies, option, reader, potential, investment tool, market conditions
Related Case Studies
| Case Title | Details | Price | Add to Cart |
|---|---|---|---|
|
Case Title Options Strategies on Microsoft and Facebook Stocks (A)Case Code: FINC102 |
Details | 400 | Add to Cart |
|
Case Title Options Strategies on Microsoft and Facebook Stocks (B)Case Code: FINC101 |
Details | 600 | Add to Cart |
|
Case Title Options Strategies on Microsoft and Facebook Stocks (C)Case Code: FINC100 |
Details | 600 | Add to Cart |
|
Case Title Turnaround Story of Wockhardt LimitedCase Code: FINC086 |
Details | 600 | Add to Cart |
|
Case Title Interest Rate Future in IndiaCase Code: FINC083 |
Details | 400 | Add to Cart |